Inventory Formulas and Calculation

AI Inventory Reports: A Practical Guide to Smarter Inventory Management
AI inventory reports give Shopify brands real-time, accurate visibility into stock levels, demand patterns, and SKU performance, turning raw data into actionable insights.
Most Inventory reports have not kept up with the times and are outdated in terms of data.
For many teams, reporting is still spread across spreadsheets, delayed by exports, and full of static numbers that don’t explain what’s really happening.
This keeps operations stuck in reactive mode: chasing stockouts, justifying overstocks, and cleaning up errors after they’ve already caused damage.
AI inventory reports change that. They bring real-time visibility, intelligent forecasting, and actionable insights into one place.
We break down what AI inventory reporting is, how it works, and the essential reports Shopify stores shouldn’t operate without.
What are AI Inventory Reports and How Do They Work?
AI inventory reports automatically track, analyze, and forecast inventory performance.
Unlike static spreadsheets or manual exports, they learn from past data in real time, highlight issues, and suggest actions.
Here’s how a typical AI inventory reporting platform works
- Pulls real-time data from Shopify, Amazon, WMS, ERPs, and other sources
- Ingests and cleans information to ensure accuracy across systems
- Runs ML models or algorithms to identify trends, outliers, and demand forecasts
- Generates visual reports (tables, charts, alerts) by SKU, location, vendor, or channel
- Triggers operational workflows such as PO generation, transfers, etc
Remember, free AI inventory reports can be a good starting point, but they’re typically limited compared to tools that automate reporting and insights in real time.
Key Features of AI Inventory Reports
AI inventory reports go beyond static dashboards; they continuously update, highlight risks, and surface actions. Some of the common features include:
1. Predictive demand insights
Reports include forward-looking demand insights and forecasts, factoring in trends, seasonality, and recent sales patterns. This helps teams plan inventory based on expected demand, not just past performance.
2. Automated insights and alerts
Instead of manually digging through data, AI reports highlight what needs attention: low stock risks, excess inventory, or unusual demand changes, and suggest next steps.
4. Granular performance tracking
AI reports do granular analysis, breaking down performance at the SKU level: fast movers, slow movers, and dead stock, so teams can make better buying, discounting, or discontinuation decisions.
5. Real-time, unified view
Inventory data across warehouses, stores, and channels is consolidated into one view, ensuring decisions are based on current, accurate information.
6. Interactive and conversational access
Some inventory systems allow teams to query inventory in plain language and get instant answers without navigating complex dashboards.
💡Prediko offers an AI agent that enables this, making it easier to access insights and take action quickly.
7. Action-focused dashboards
AI dashboards are built around key inventory metrics like stock levels, turnover, and sell-through, but more importantly, they surface actions, which sometimes can be executed directly from the report.
Benefits of Using AI Inventory Reports
Below are the key benefits businesses and ecommerce stores see when they switch to AI-powered inventory reporting.
1. Improved data accuracy and speed
AI tools automatically pull and update inventory data from ecommerce platforms like Shopify, Amazon, and ERPs.
This reduces errors from manual entry and gives your team faster access to reliable numbers, whether you're checking stock levels, reconciling SKUs, or validating supplier deliveries.
2. Cost savings
With accurate and timely reports, you avoid overstocking, stockouts, and last-minute reorders. This directly reduces carrying costs, shipping expenses, and lost revenue. You also save time spent on manual audits and corrections.
3. Efficient planning and stock optimization
AI inventory reports highlight what’s changing, like shifts in demand, PO delays, or SKU-level returns, so you can act early. This improves planning and helps your team reorder the right items at the right time for your business.
4. Scalability and automation
As you grow, AI systems can handle increasing SKUs, sales channels, and warehouses without added manual work or headcount.
You can easily keep pace by automating analysis, detection, and reporting so that scaling doesn’t come at the cost of accuracy or visibility.
While many teams rely on AI inventory report templates, they’re often limited. Whereas, modern tools automate this entirely, removing the need for manual reporting.
What Makes AI Inventory Reports Better than Traditional Reports
Unlike traditional inventory reports that simply present raw data, AI-powered reports actively interpret and respond to it.
Below are the key differences that make AI inventory reports more actionable and reliable.
1. Automated insight generation
Traditional reports rely on manual data pulls and spreadsheets, requiring teams to dig through rows and apply formulas for basic insights.
In contrast, AI reports automatically analyze incoming data and flag issues (like unusual stock movement or demand spikes), delivering instant visibility without extra effort.
2. Offers recommendations, not just data
Where traditional reporting ends at raw numbers, AI reports go further by offering next steps.
For example, they might suggest a reorder quantity or highlight which POs are late, helping teams act faster, rather than analyze after the fact.
3. Pattern recognition at scale
Manual tools can miss larger trends or channel-specific issues.
AI reports process data across platforms and timeframes, surfacing patterns like seasonal spikes or inconsistent supplier performance that would otherwise go unnoticed.
4. SKU-level reporting accuracy
Traditional methods often suffer from mismatched SKUs, duplicate entries, or outdated counts.
AI systems pull directly from platforms like Shopify, Amazon, and WMS to deliver consistent, real-time SKU-level accuracy across the board.
5. Real-time recalibration with new data
Unlike static traditional reports, AI dashboards adjust automatically as orders, returns, or stock changes happen. This way, your decisions are based on the latest data, not numbers that are already stale.
6. Ability to simulate scenarios
Scenario planning with spreadsheets is slow and error-prone.
AI reports allow you to simulate changes in demand or lead times instantly, helping you prepare for what could happen next instead of just reacting to what happened.
AI Inventory Reports Vs Traditional Reports
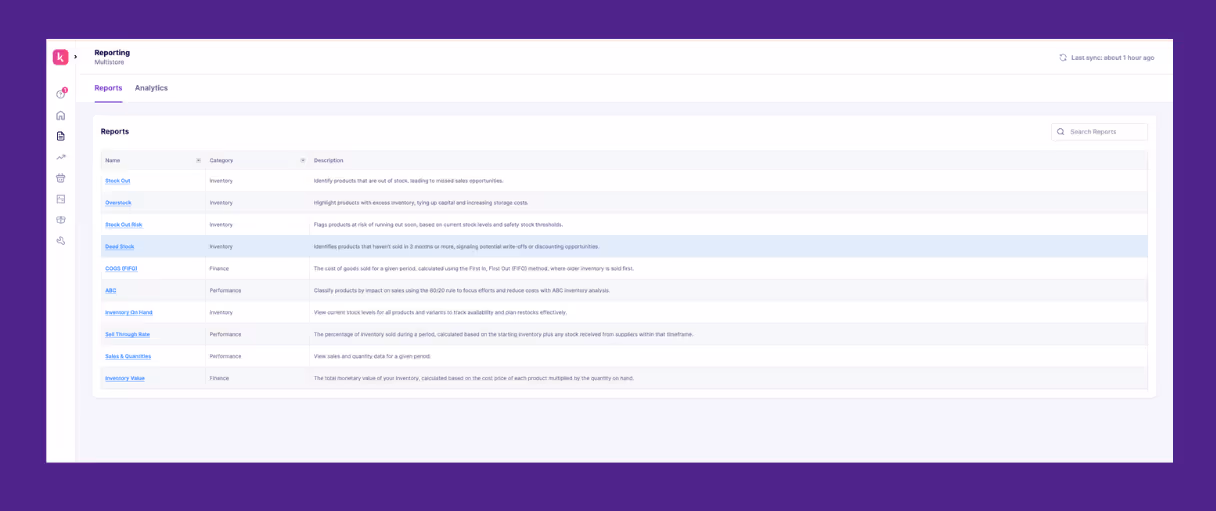
Types of AI Inventory Reports
Each AI inventory management report gives you a different lens into how your products move, where you’re exposed, and what needs your attention now versus later.
Below is a breakdown of the essential AI inventory management reports examples, what they cover, and how they help your team operate with more clarity and confidence.
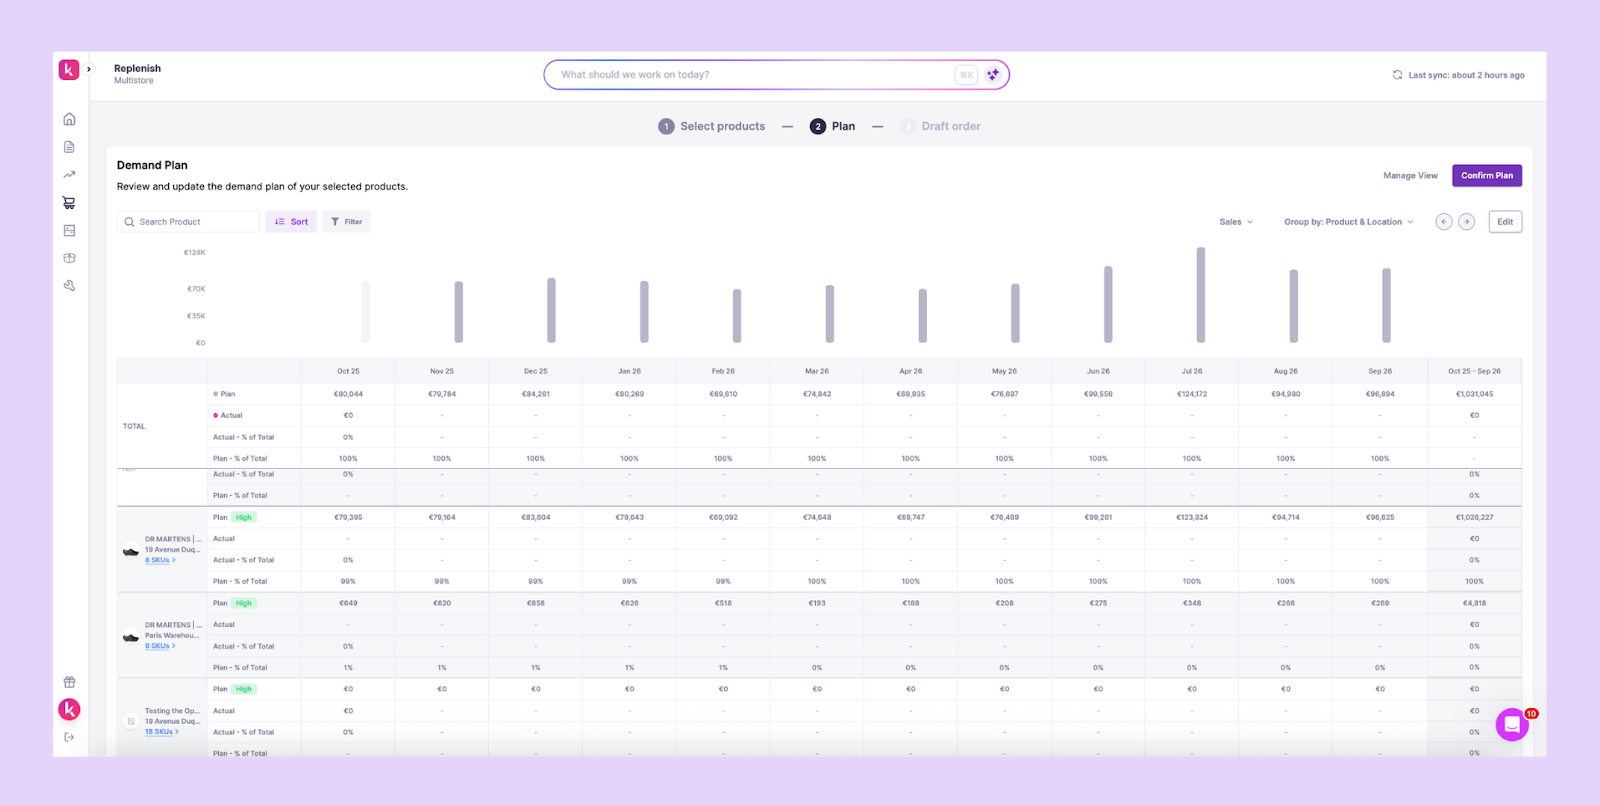
1. Sales & Quantities Report
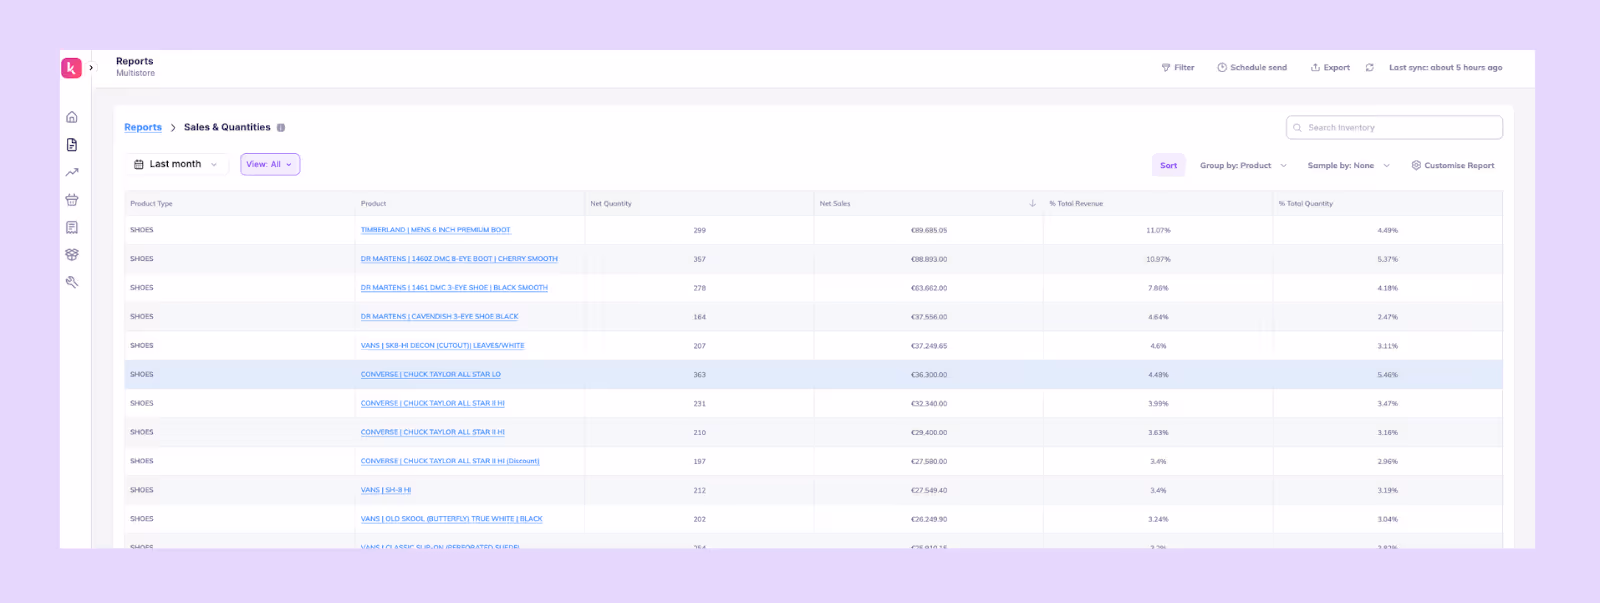
What it is: This report gives you a real-time view of how each SKU is selling, using AI to detect demand patterns and velocity shifts earlier than manual reporting.
How it helps: Helps you understand which products are accelerating, slowing down, or behaving unusually so you can adjust forecasts, production plans, or marketing before trends fully form.
What it includes: Net quantity, Net sales, % Total quantity, and % of Total revenue
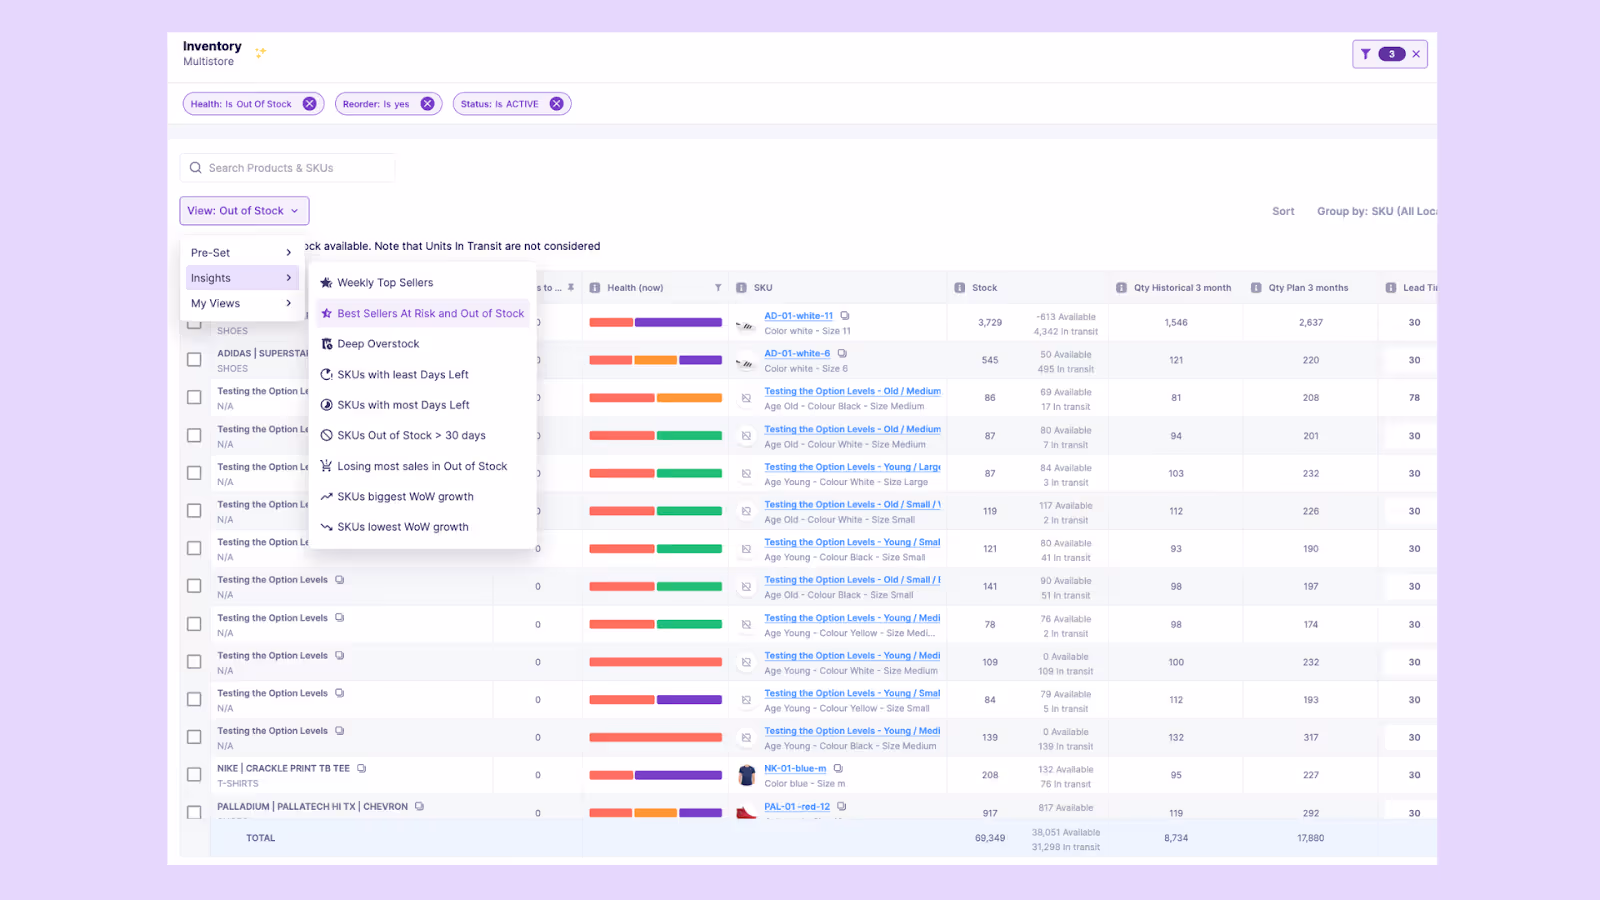
2. Stock Out Report
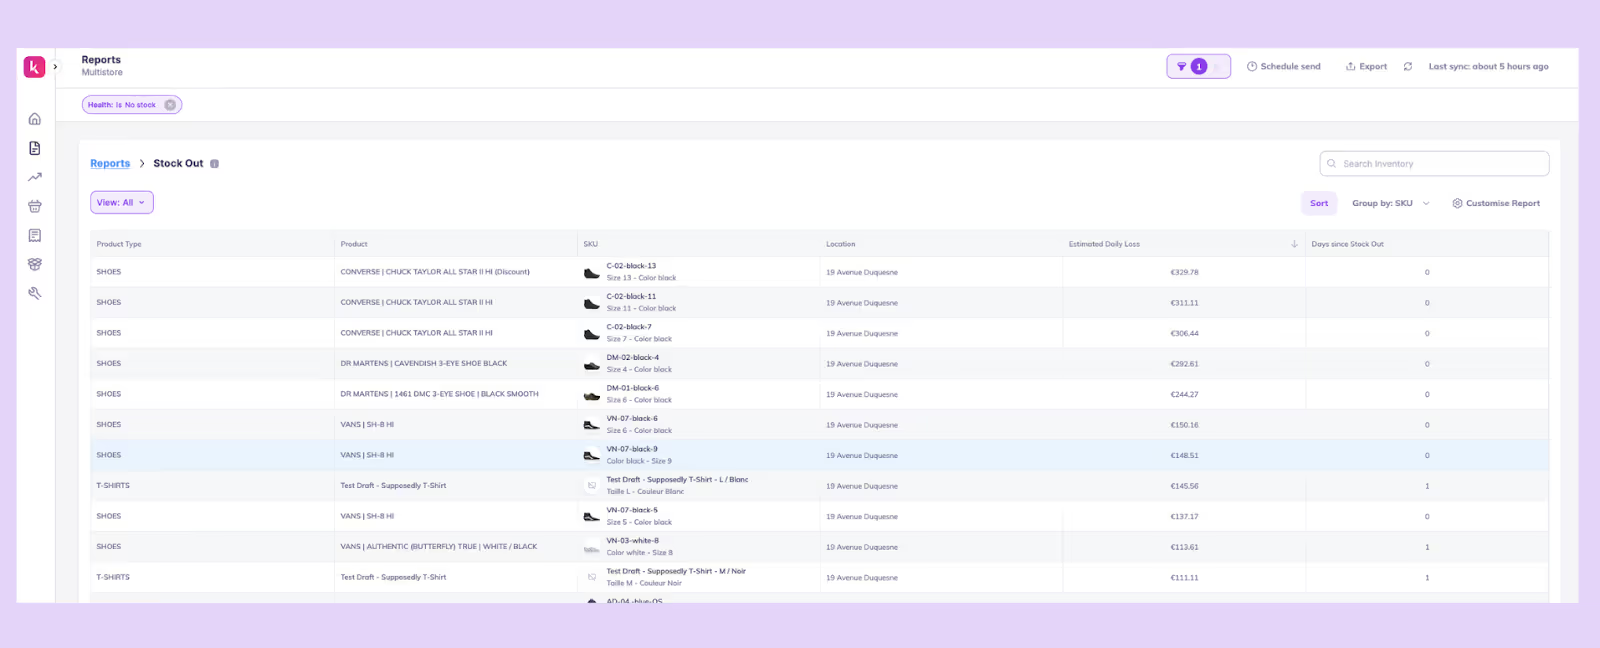
What it is: This is a report showing all products that have hit zero inventory, with AI estimating the impact and prioritising what needs attention first.
How it helps: It alerts you about the immediate revenue loss, helps you pause ads or update product pages, and guides urgent replenishment decisions.
What it includes: SKUs at 0, Location, Days since stock out, and Estimated daily loss.
3. Overstock Report
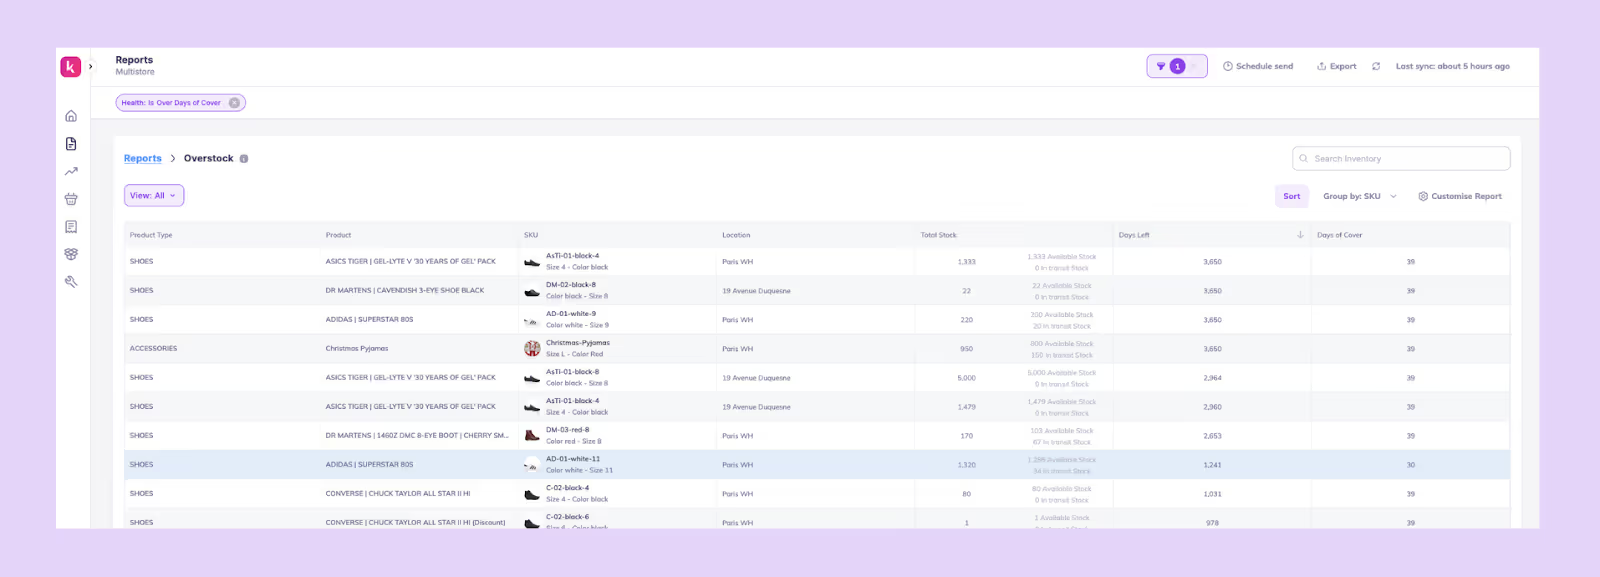
What it is: This AI inventory management report template gives you a view of SKUs with more inventory than demand requires, using AI to detect slow movers and future overstock risks before they pile up.
How it helps: Helps you reduce carrying costs, plan discounting or bundles, and prevent dead stock by catching the problem early.
What it includes: SKU, Location, Total stock, Days left, and Days of cover.
4. Stock Out Risk Report
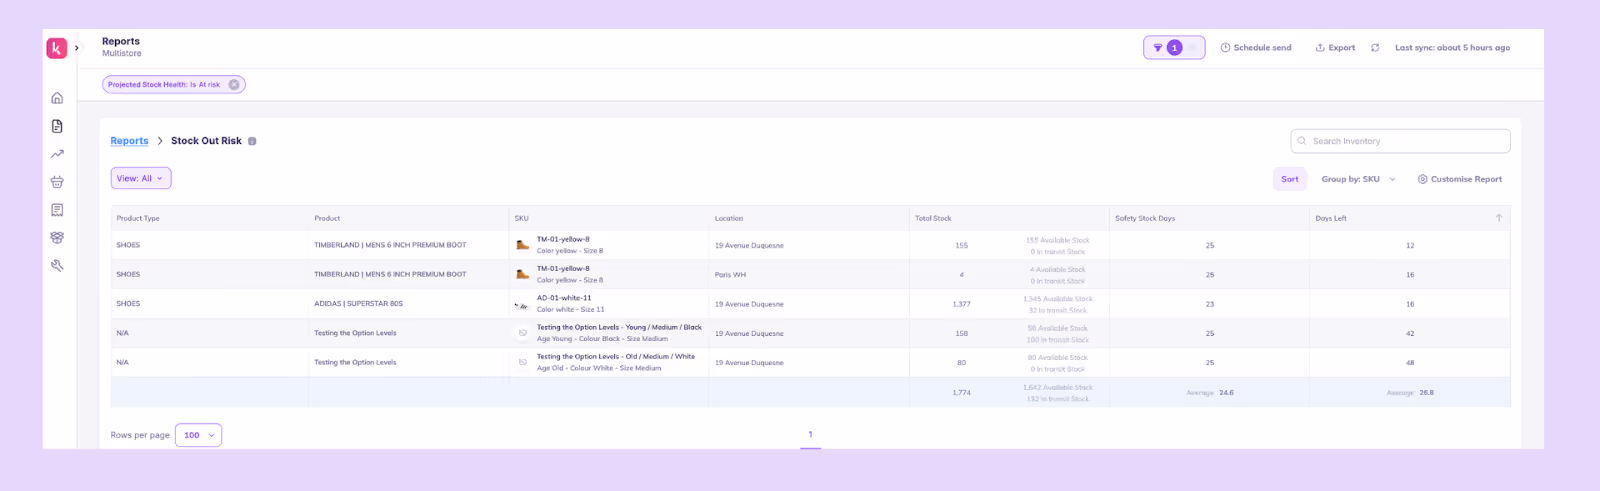
What it is: This report is an AI-powered prediction of which SKUs are likely to run out soon, even if they currently appear “safe.”
How it helps: Gives you advance warning so you can place timely POs, adjust safety stock, or transfer inventory between locations before stockouts happen.
What it includes: SKU, Location, Total stock, Safety stock days, and Days left.
5. COGS (FIFO) Report
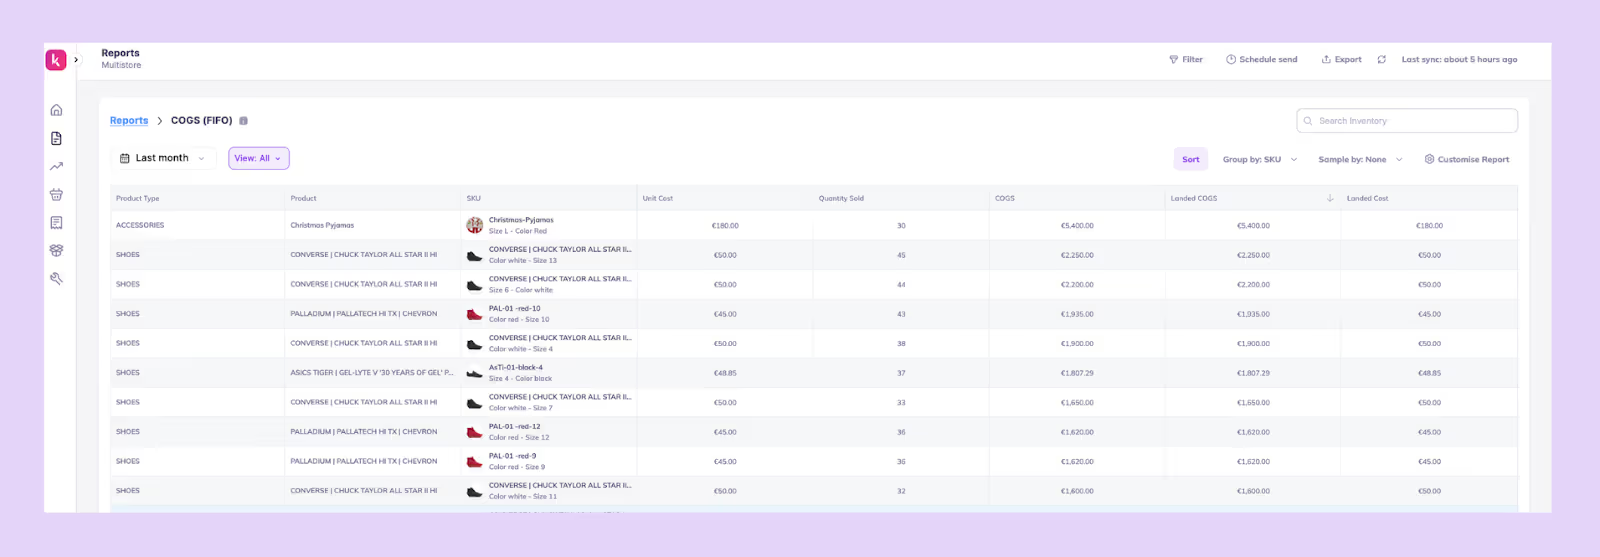
What it is: This one is a financial report that applies FIFO costing automatically to show true SKU-level profitability.
How it helps: Gives accurate COGS and margin visibility so you can refine pricing, plan promotions responsibly, and evaluate product-level performance.
What it includes: SKU, Unit cost, Quantity sold, COGS, Landed COGS, and Landed cost.
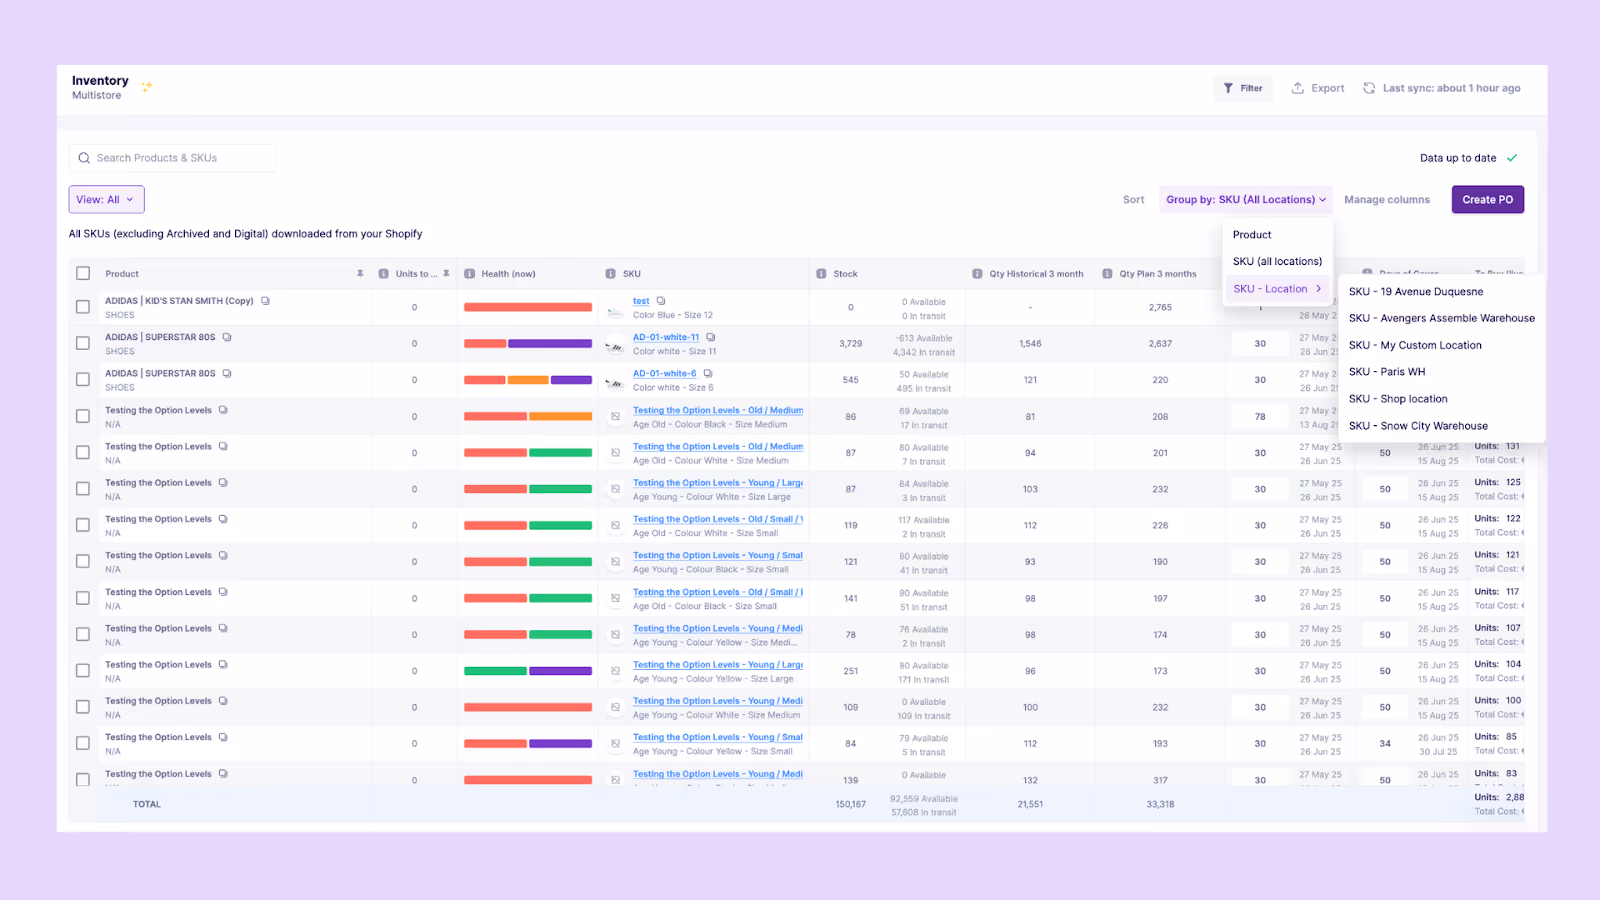
6. Multi-Location Sell Through Report

What it is: This is a comparison of how inventory performs across warehouses, stores, or fulfillment locations.
How it helps: Shows where stock is stuck or moving too fast, helping you transfer or restock, avoid localized stockouts, and optimize fulfillment decisions.
What it includes: Product, Location, Quantity sold, Total stock, and Sell-through rate.
7. ABC Report
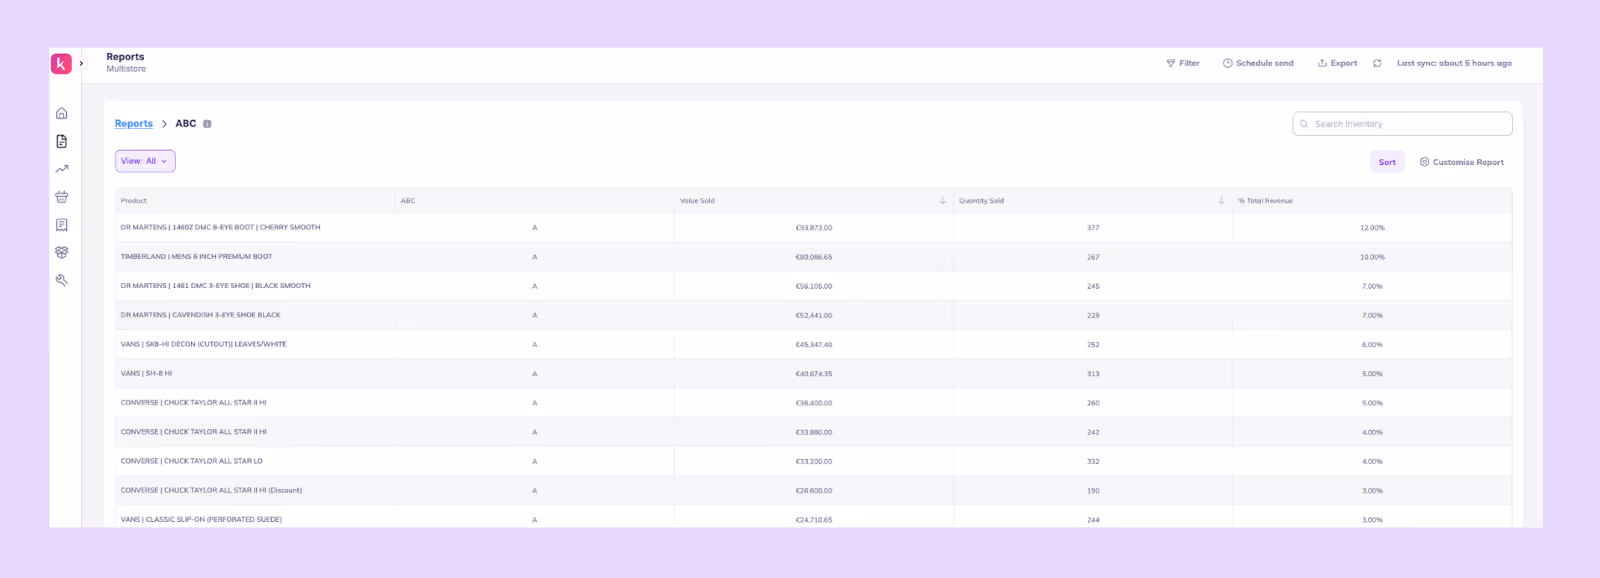
What it is: This report is a classification of SKUs into A, B, and C categories based on contribution to revenue, demand consistency, or profitability, automatically refreshed by AI as patterns change.
How it helps: Helps you focus forecasting, purchasing, and promotion efforts on the SKUs that matter most to your business.
What it includes: Product, ABC rankings, Value sold, Quantity sold, and % of Total revenue.
Best Practices to Get the Most From AI Inventory Reports
AI reports are only as good as the data and context you feed into them.
The more accurately your operations are modeled, the more precise your forecasts, alerts, and reports will be.
Here’s how to tighten your setup so that AI reporting becomes a source of smarter inventory decisions.
1. Set your lead times and safety stock correctly
Your AI reports depend on how accurate your operational inputs are, so start by verifying your lead times and safety stock.
Instead of using a blanket lead time for all products, calculate actual averages for the past 6-12 months per supplier or category. If Supplier A takes 28-32 days while Supplier B takes 18-40 days, your AI needs to know that difference to make realistic reorder suggestions.
Once lead times are correct, adjust your safety stock with a simple but reliable formula. For example, if your average lead time is 30 days but the longest stretch has been 45, your safety stock should cover for those 45 days, not the ideal 30.
When these values are accurate, your AI’s days of cover, reorder dates, and stockout predictions become far more trustworthy.
2. Keep the catalog clean
AI struggles when your catalog is messy. So treat catalog hygiene as part of your reporting process.
Simplify your products by removing dead SKUs that haven’t moved in months, fixing duplicate SKUs, and ensuring every product has clean variant relationships and consistent metafields like category, supplier, and collection.
Bundles often break reports and forecasting if not mapped correctly. AI will predict demand for the bundle but miss the fact that each sale consumes multiple underlying SKUs. A simple fix is maintaining an accurate bill of materials and linking bundle components properly.
A clean, structured catalog helps AI identify real patterns, catch demand shifts early, and avoid false signals from clutter or mis-mapped product data.
3. Track supplier reliability
AI insights get sharper when they’re grounded in real supplier performance rather than assumed dates.
Build a habit of noting the promised and actual delivery dates for every PO and tracking issues like partial shipments or quality failures.
Over time, this creates a reliability score for each supplier; some may consistently deliver within 5% variance while others fluctuate widely.
When your AI learns that Supplier C is often late, it automatically extends reorder buffers or suggests earlier POs, instead of giving you false confidence.
4. Create report schedules
AI reports only lead to action when they are delivered at the right time to the right people.
Instead of checking dashboards manually, schedule recurring reports: daily low-stock alerts for warehouse teams, weekly demand summaries for planners, and monthly aging or excess inventory reports for finance and ops.
A consistent reporting cadence ensures insights don’t just sit inside the tool; they trigger workflows and keep teams aligned around forecasting, replenishment, and inventory health.
5. Use scenario planning before major events (BFCM)
AI is most powerful when it helps you plan for the future, not just analyze the past. Before big events like BFCM, use scenario planning to test different sales uplifts: 2x, 3x, or 5x your baseline and see how your coverage, replenishment dates, and stockout timelines shift.
This helps you answer questions like “If my top SKUs sell 4x faster, when do I run out?”
For example, if a product normally sells 10 units/day but historically jumps to 40/day during BFCM, your AI will immediately flag that the current stock will only last a few days.
Running these scenarios early helps you adjust now, whether that’s increasing safety stock, placing POs sooner, or redistributing inventory, rather than firefighting mid-sale.
Examples of AI Inventory Tools & Applications
Below are some commonly used AI inventory tools and how they’re applied in practice.
1. Prediko
Built for Shopify-first brands, Prediko combines AI demand forecasting, replenishment planning, and PO management in one platform.
It helps teams automate buying decisions, track stock across locations, and act on real-time insights without relying on spreadsheets. It also offers AI agents that can execute tasks on autopilot, reducing manual work and speeding up day-to-day operations.
2. Manhattan Active
Manhattan Active focuses on execution at the warehouse and fulfillment level. It uses AI to optimize picking, packing, order routing, and inventory movement across distribution centers, making it suitable for large, complex supply chains.
3. Toolio
Toolio’s AI is built for merchandising teams to plan assortments and manage open-to-buy budgets. It connects inventory decisions with financial goals like revenue, margins, and sell-through, helping teams decide what products to invest in.
4. Cin7
Cin7 is a software that lets you manage inventory, orders, and sales channels. Its Foresight AI helps maintain stock accuracy across retail, wholesale, and online channels, and helps streamline operational workflows like order syncing and fulfillment.
5. Oracle Retail
Oracle Retail provides a full suite of planning tools, including demand forecasting, replenishment, and allocation, all powered by AI. It’s typically used by large retailers managing thousands of SKUs and multiple locations, where centralized planning is critical.
6. RELEX Solutions
RELEX uses machine learning to forecast demand and allocate inventory across stores and distribution centers. It helps retailers ensure the right products are available in the right locations, especially in high-volume, multi-store environments.
How Prediko Automates AI Inventory Reporting for Shopify Stores
Prediko takes the manual work out of reporting by turning your raw inventory data into clear, automated insights you can act on every day.
Instead of pulling spreadsheets, reconciling numbers, or guessing what will sell next, Prediko’s AI processes your sales, stock levels, lead times, and supplier data in the background and delivers the reports directly to your inbox or dashboard.
1. 20+ Ready-to-use AI inventory reports
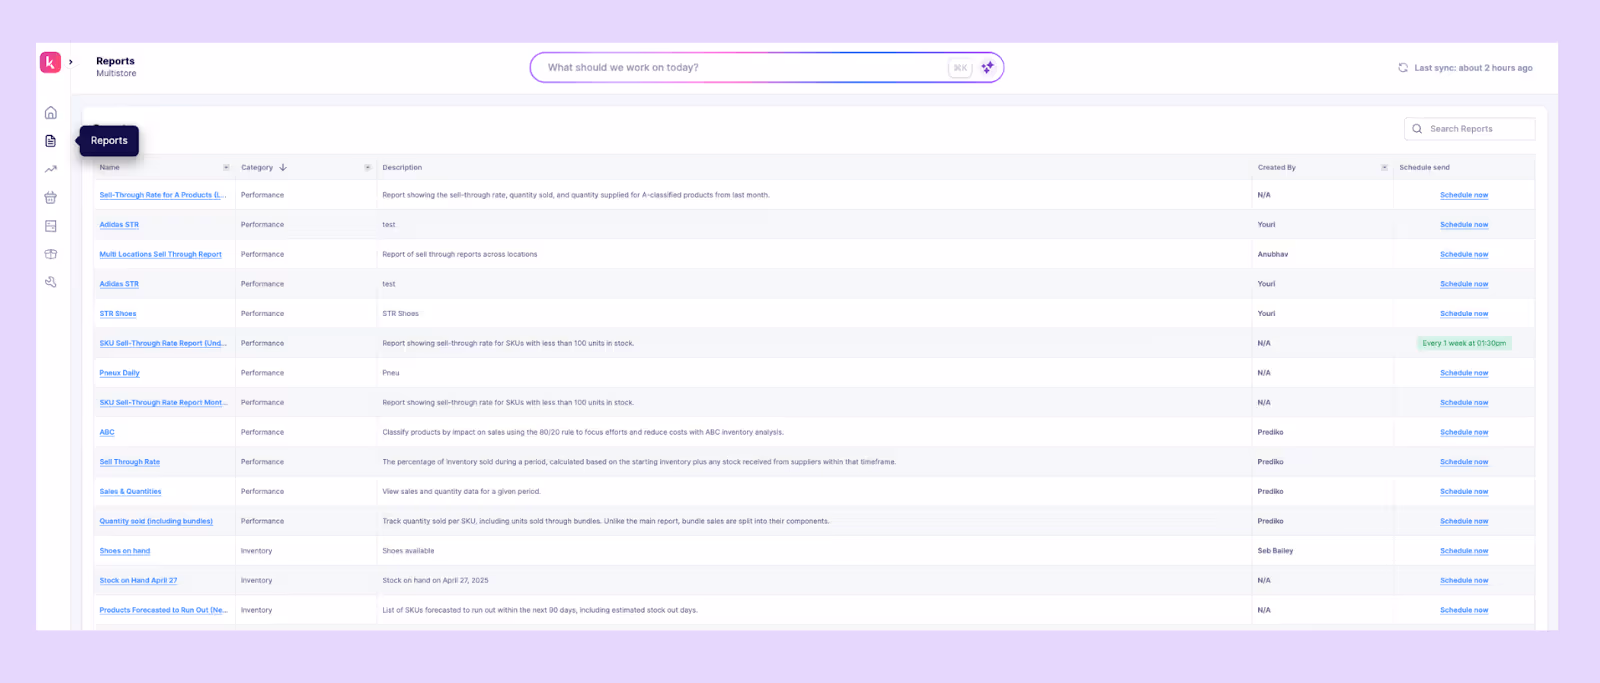
Prediko comes with more than 20 AI-powered inventory reports, from sell-through and stockout risk to overstock, ABC analysis, and multi-location insights. Each report is automatically updated and built to highlight the right operational signals at the right time.
2. Daily/weekly automated email reports
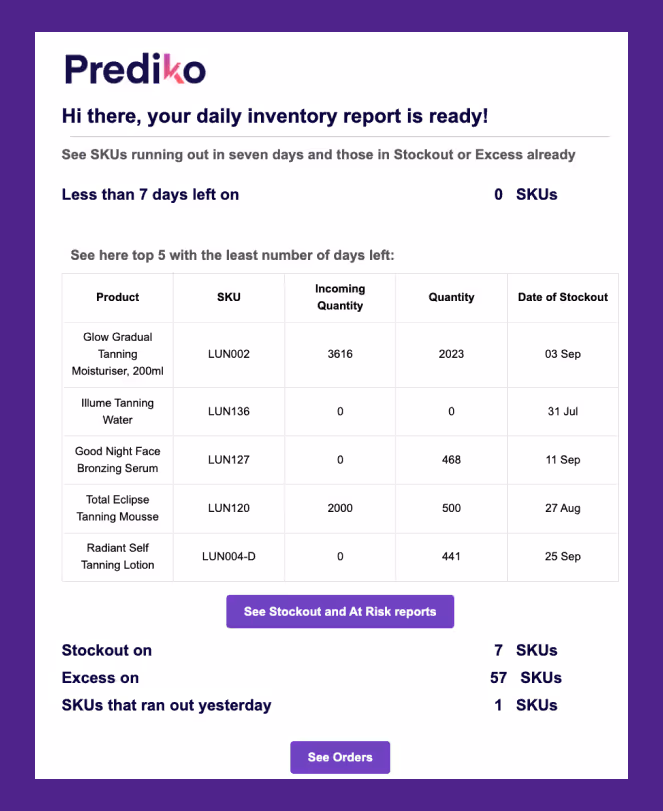
Prediko sends scheduled reports straight to your inbox so you don’t have to manually check dashboards. You get daily or weekly updates on stockouts, overstock, sales velocity, and upcoming stockout risks.
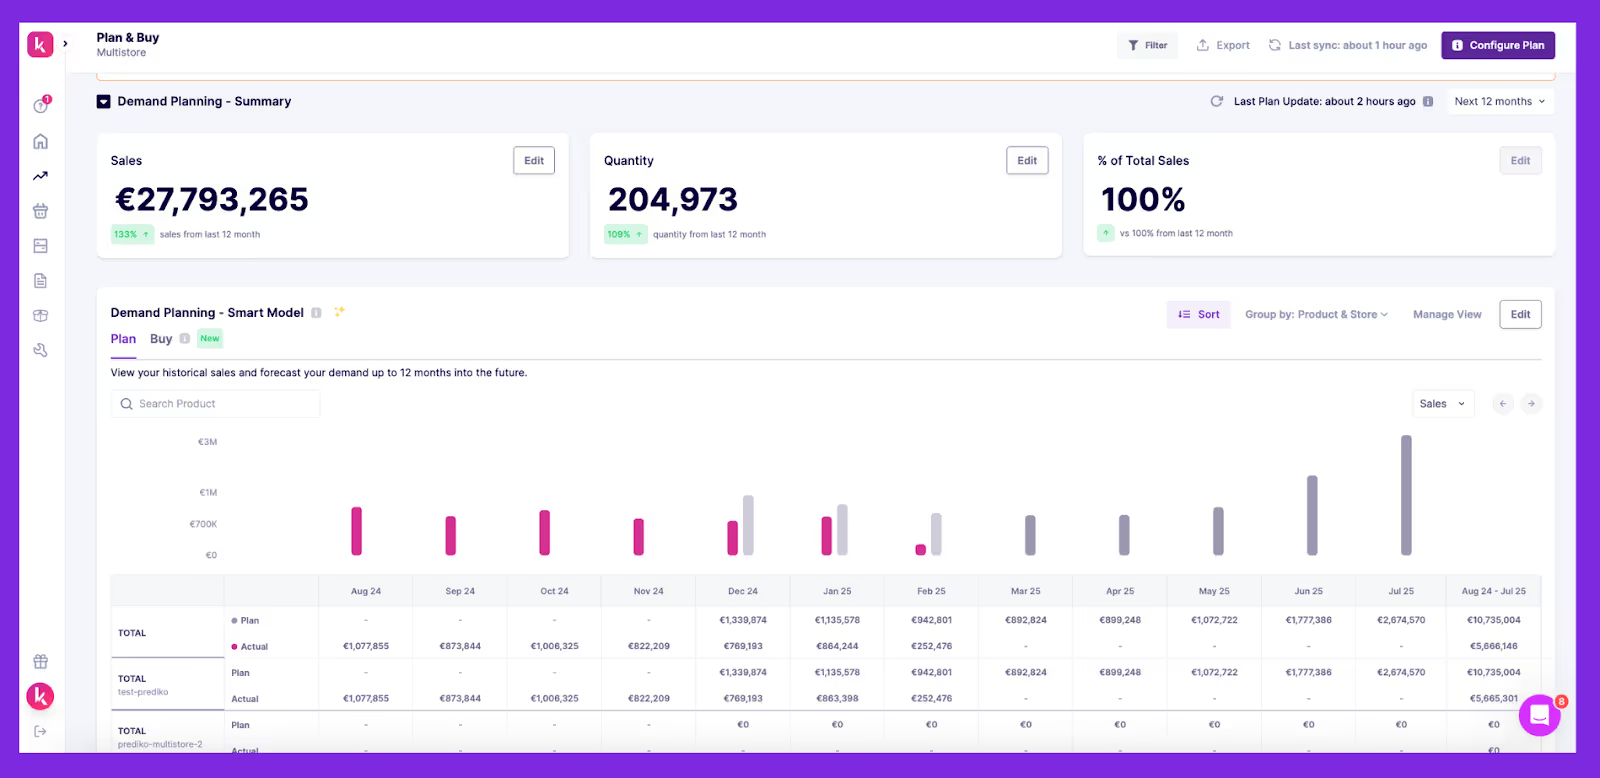
3. AI Forecasting engine trained on 25M SKUs
Prediko’s forecasting AI, trained on more than 25 million SKUs across 15 industries, detects demand shifts, seasonality patterns, and velocity changes earlier than spreadsheet models. It recalibrates constantly to deliver accurate reorder dates and quantities.
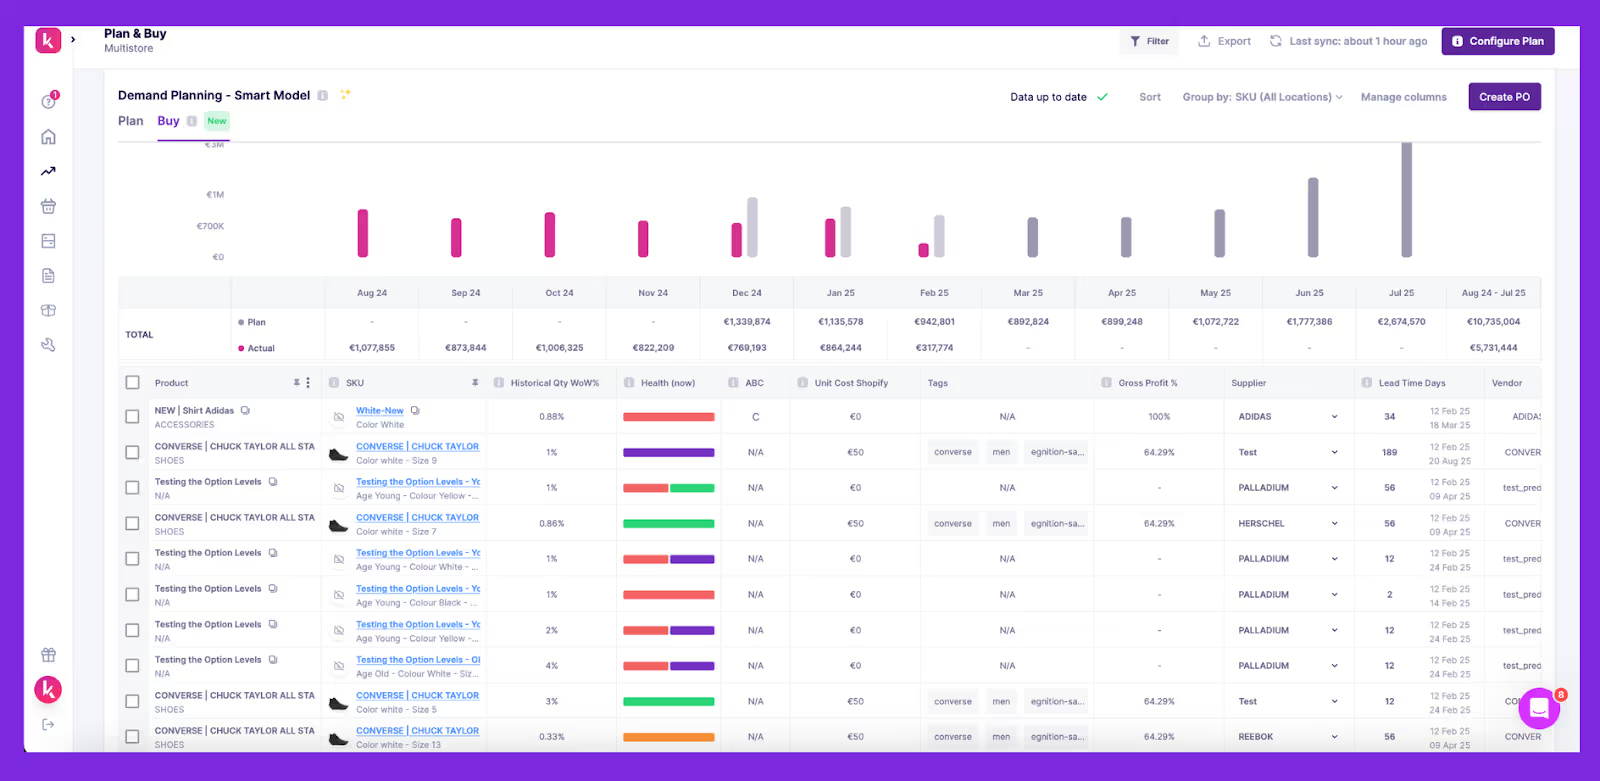
4. Store, SKU, variant, and warehouse-level insights
Prediko breaks down demand and stock behaviour at every layer –by store, warehouse, SKU, and variant –so you know exactly where products move well and where they stall.
5. Multi-location coverage
Prediko compares performance across warehouses, stores, and 3PLs to highlight imbalances. It shows where stock is running out, where it’s piling up, and where transfers can prevent stockouts or excess.
6. Supplier and PO tracking
You can easily track incoming POs and shipments directly inside Prediko, and once items are marked as received, Prediko automatically updates your stock levels everywhere. No manual edits as forecasts and reports stay accurate in real time.
7. Integrations with Shopify, WMS, 3PLs
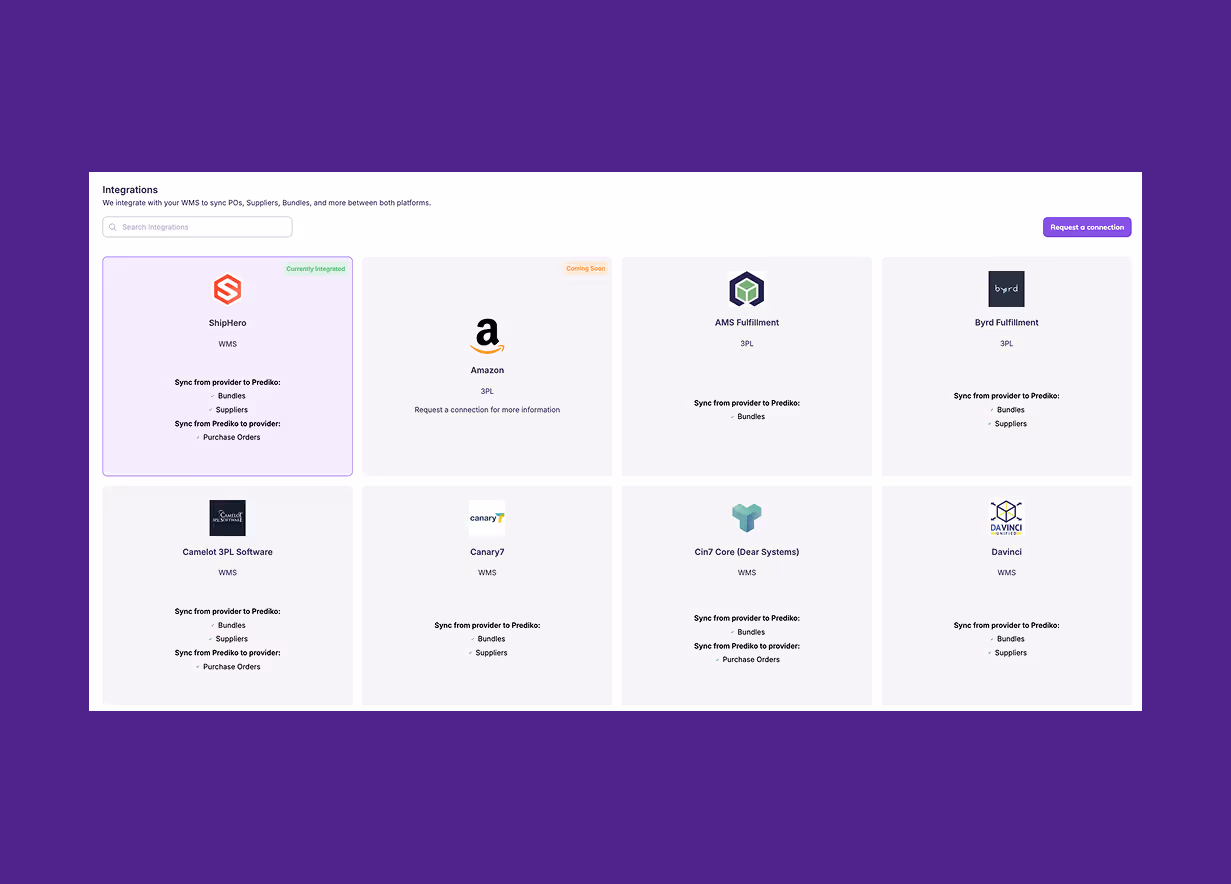
Prediko syncs with Shopify, warehouse systems, and 3PLs so every report reflects real-time stock movements, orders, receipts, and transfers without manual reconciliation.
If you’d like to see how these reports and features work in practice and how much time they can save your team each week, start a 14-day free trial of Prediko and explore everything using your own data.
Frequently Asked Questions (FAQs)
.avif)
How to Calculate Days Sales in Inventory (DSI)? Formula & Examples
Curious how long your inventory takes to turn back into cash? Learn what Days Sales in Inventory (DSI) means, how to calculate it, and tips to improve it.
Picture running an online store where some products ship out the same day they’re stocked, while others sit in the warehouse for weeks waiting for a buyer.
Fast movers keep cash flowing back into your business, but the slow ones quietly lock up money and space.
That’s the balance of Days Sales in Inventory (DSI) measures, and managing it is no easy task.
We’ll explain how to calculate DSI, what the number really means, and how to keep it under control with the right tools and strategies.
What is Days Sales in Inventory (DSI)?
Days Sales in Inventory (DSI) measures how many days, on average, it takes for a business to sell its inventory. The formula to calculate it is
DSI = (Average Inventory ÷ Cost of Goods Sold) × No. of days (commonly 365 days)where
- Average Inventory = (Beginning Inventory + Ending Inventory) ÷ 2
- COGS = Cost of Goods Sold during the period
A lower DSI indicates faster inventory turnover and better cash flow, while a higher DSI suggests stock is sitting longer, tying up working capital and increasing the risk of obsolescence.
Why is Days Sales in Inventory Important?
Days Sales in Inventory (DSI) isn’t just a number; it’s a window into how efficiently your business manages stock. For Shopify merchants, understanding DSI is critical because it
- Impacts cash flow: Reveals how quickly cash tied up in inventory returns to the business
- Drives working capital efficiency: A lower DSI frees up cash for daily operations or growth initiatives
- Highlights risk: A higher DSI increases chances of obsolescence, markdowns, or costly write-offs
- Affects profitability: Longer holding periods raise carrying costs and may require extra financing.
How to Calculate Days Sales in Inventory (Step-by-Step)
We’ve put together a simple step-by-step process to help you calculate Days Sales in Inventory.
Step 1: Determine average inventory
Average inventory is calculated by taking the sum of opening inventory and closing inventory for the period, then dividing by two.
This smooths out fluctuations and gives a more representative value than using a single date.
Formula
(Opening Inventory + Closing Inventory) ÷ 2
Step 2: Calculate cost of goods sold (COGS)
Next, find out the cost of goods sold for the same period. COGS includes the direct expenses of producing or purchasing the products that were sold, such as raw materials and direct labor.
It should not include overhead costs like marketing or distribution. Using the matching period aligns the numerator (inventory) and the denominator (COGS), helping to produce an accurate metric.
Step 3: Select period length
The most common period length used in DSI is 365 days, which gives an annual view of inventory efficiency.
However, companies may also calculate DSI for a quarter (90 days) or a month (30 days) to monitor performance more closely.
The choice depends on reporting needs, but consistency is critical so comparisons across periods are valid.
Step 4: Apply the Days Sales in Inventory formula
Now apply the formula.
DSI = (Average Inventory ÷ COGS) × Period LengthLet’s say
- Annual COGS = $1,000,000
- Average inventory = $150,000
Then, DSI = (150,000 ÷ 1,000,000) × 365 = 54.75 days
This means it takes the company almost 55 days, on average, to sell its inventory. If DSI is reduced to 45 days, the amount of working capital freed is:
(54.75 − 45) ÷ 365 × 1,000,000 = $26,712
That is nearly $27,000 of cash released back into operations without any increase in sales or reduction in costs.
Variants of DSI calculation
The standard formula works for most cases, but different industries and reporting needs often require adjustments. Some of the common variations include.
- Using ending inventory instead of average inventory for a quick snapshot, though it can distort results if inventory levels fluctuate seasonally
- Calculating DSI at retail prices rather than cost, which may be useful for merchandising reports but inflates the ratio and is less accurate for financial analysis
- Including work-in-progress (WIP) inventory in manufacturing, where partially completed goods are a large part of total stock
- Calculating DSI separately for each warehouse or distribution center to identify where inventory is slower to move
- Measuring DSI at the SKU level to reveal problem products, rather than only tracking the company-wide average
These variations provide flexibility depending on the question being asked, but for financial reporting and benchmarking, the average inventory and COGS method remains the most reliable.
What are the Common Pitfalls of Days Sales in Inventory Calculation?
While Days Sales in Inventory (DSI) is a powerful metric, it’s easy to miscalculate or misinterpret.
Here are some common pitfalls to watch out for:
1. Using inaccurate or inconsistent sales data
A frequent mistake is relying on sales data from a period that does not reflect normal activity. For example, calculating DSI using only peak-season sales will make inventory appear to move faster than it usually does.
On other hand, using only off-season data may exaggerate how long stock sits. To avoid skewed results, the calculation should be based on a full year or an average of comparable periods.
2. Including non-sellable or reserved stock
Another error is including items that cannot actually be sold. Damaged goods, products awaiting return to suppliers, or inventory reserved for specific customer orders inflate the reported stock figure without representing real sellable units.
Even in-transit goods may distort results if they are counted before they are available to fulfill demand. The purpose of DSI is to measure how quickly inventory converts to sales, so only items available for sale should be included in the calculation.
3. Ignoring returns or cancellations
Returns and order cancellations are often overlooked when calculating DSI, but they directly reduce the effective volume of goods sold. If they are excluded, COGS is understated and DSI looks better than it really is.
In industries with high return rates, such as fashion or electronics, the impact can be significant.
Adjusting for returns and cancellations ensures that the days sales in inventory ratio reflects true sales performance rather than just gross shipments. This gives a more realistic picture of how quickly inventory is being cleared.
What is a “Good” Days Sales in Inventory (DSI)?
There is no single number that defines a good DSI because turnover speed depends heavily on industry, product type, and supply chain model.
A grocery store must move stock in days, while a luxury brand can hold items for months without issue. The key is to compare DSI against peers in the same sector and to track trends over time within the business.
A “good” DSI is one that reflects efficient inventory turnover relative to industry standards while supporting product availability and customer demand.
DSI vs DIO vs Inventory Turnover
Days Sales in Inventory (DSI), Days Inventory Outstanding (DIO), and Inventory Turnover all measure how efficiently inventory is managed. The terms DSI and DIO are often used interchangeably, while inventory turnover provides the inverse view.
In practice, DSI and DIO are two names for the same metric, while inventory turnover flips the perspective to show how many cycles occur in a year. Lower DSI and higher turnover generally indicate faster movement of goods.
Why do Days Sales in Inventory Change Over Time
DSI is not a static figure. It shifts with changes in demand patterns, supply chain conditions, and pricing strategies. Understanding the drivers behind those shifts helps explain whether the change is healthy or a signal of risk.
- Seasonality: Holiday peaks and off-season slowdowns naturally cause swings in inventory holding periods, affecting DSI
- Promotions: Discounting or clearance sales can temporarily lower DSI as stock sells faster
- SKU proliferation: Adding more product variants increases complexity and can slow turnover if demand is spread between the products
- Forecast error: Overestimating demand drives up excess stock, while underestimating causes shortages, both of which can distort your DSI
- Supplier lead times: Longer or unpredictable lead times force merchants to keep higher safety stock, raising DSI
- Manufacturing batch sizes: Large production runs may keep inventory high until sales catch up
- Returns and quality issues: High return rates or rejected goods lengthen the time inventory sits before reselling or disposal
Managing Days Sales in Inventory Effectively
Lowering DSI requires a mix of immediate actions and long-term process improvements. A practical way to approach it is by phasing actions over different time horizons. Here is how companies can structure their efforts.
Quick wins (first 30 days)
- Identify top 20 SKUs that contribute most to excess inventory and take targeted action
- Run promotions or bundles to clear slow-moving stock without heavy margin losses
- Re-evaluate your reorder points and go for demand-driven replenishment so that you reorder based on actual demand
Medium horizon (around 60 days)
- Negotiate shorter lead times with suppliers to reduce the need for high safety stock
- Set safety-stock levels by SKU instead of blanket rules to avoid unnecessary holding costs
- Adjust manufacturing or purchase lot sizes so that inventory does not accumulate in bulk
Deeper changes (around 90 days)
- Implement automated replenishment apps and solutions to reduce manual errors in ordering
- Align purchasing cadence more closely with demand signals from sales data and forecasts
Longer-term strategy (6–12 months)
- Invest in better forecasting methods like AI-powered forecasting models to anticipate demand with higher accuracy
- Explore vendor-managed inventory arrangements to shift stock responsibility upstream
- Apply multi-echelon inventory optimization (distribute stock where it’s needed most) across warehouses or regions to balance inventory efficiently
- Establish strong data governance so inventory numbers are reliable and actionable
How Prediko Helps Optimize Days Sales in Inventory
Prediko is built to shorten inventory holding periods by aligning purchasing and stock levels with actual demand.
With its AI-powered inventory planning and management, Shopify brands can cut excess stock, prevent shortages, and lower their DSI, all while keeping product availability high.
Here’s how its features make that possible.
- AI demand planning: Prediko forecasts future demand using historical sales, seasonality, and growth trends so businesses order the right quantities at the right time. This reduces overstocking and stockouts that skew DSI.
- Buying plan and purchase order automation: The platform automatically creates buying plans and generates purchase orders based on real-time demand. This smarter approach to purchasing keeps inventory flowing steadily instead of piling up, helping reduce DSI.
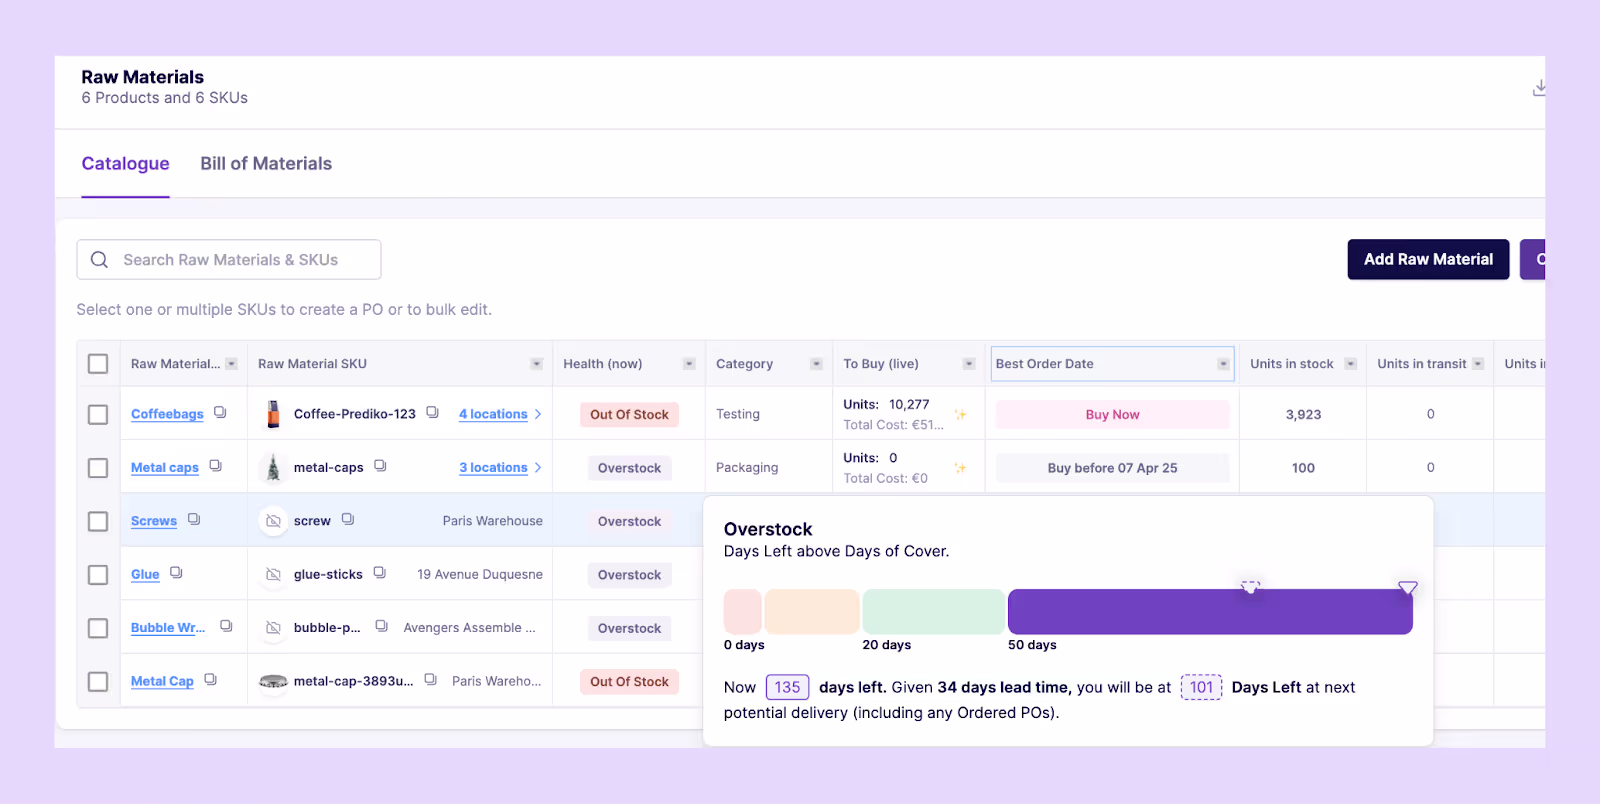
- BOM and raw materials management: For manufacturers, Prediko tracks and forecasts raw materials.
You can also create bills of materials (BOMs) for finished goods. This visibility prevents production delays and excess component stock, keeping inventory cycles tighter.
- Multi-store and warehouse visibility: For Shopify brands with multiple locations, Prediko provides a single view to track and manage stock across all warehouses and stores. This makes it easier to balance inventory between locations, reducing slow-moving stock that drives DSI up.
- Analytics and reporting: Prediko offers 10+ report templates and analytics with insights on SKU-level performance, stockout costs, overstocks, and sell-through rates. This data helps teams act quickly to clear bottlenecks and sustain a healthy inventory turnover.
How to Report DSI to Stakeholders
When sharing DSI with stakeholders, the goal is to make the number easy to interpret and tie it to business impact.
Instead of presenting a single figure, use visualizations that highlight trends and problem areas.
Here are some effective methods to report it.
- Rolling 12-month DSI trend line to showcase improvement or deterioration over time
- SKU heatmap so that stakeholders can identify products that are driving excess holding
- Cohort charts to compare the performance of new product launches versus older ones
- Cash conversion cycle (CCC) dashboard linking DSI with DSO and DPO for a full working capital view
Keep Days Sales in Inventory Under Control
Days Sales in Inventory is a key metric that shows whether your inventory is fueling growth or tying up capital.
By calculating it correctly, benchmarking against your industry, and acting on the drivers of change, you can free up working capital while still meeting customer demand.
Prediko gives you everything to take control of DSI, from AI demand planning to real-time purchase order management and multi-location visibility.
With the right systems in place, inventory stops being a drain on cash flow and becomes a lever for growth.
Start your 14-day free trial and see how Prediko helps reduce DSI with its smart features.
Frequently Asked Questions (FAQs)
.avif)
Shopify Inventory Value: How to Calculate, Report, and Automate [2026]
Learn what Shopify inventory value is, how to calculate it, and why it matters for D2C brands. A practical guide to tracking, managing, and reporting it.
If you don’t know the true value of your inventory, you don’t really know how much cash is tied up in stock, how accurate your profit margins are, or what you actually owe in taxes.
When inventory value is miscalculated, profits can look healthier than they are, tax bills arrive higher than expected, and too much capital sits locked in products that aren’t moving.
For Shopify merchants managing multiple SKUs and locations, even small errors can snowball into major financial gaps.
We break down how to calculate Shopify inventory value correctly and the common mistakes that distort the numbers.
What is Shopify Inventory Value and Why It Matters
Shopify inventory value is the total cost of products you currently hold in stock. It’s based on purchase cost, not selling price, and updates as inventory moves in or out.
It matters because it directly affects the following
- Cash flow: A high inventory value means more capital tied up in unsold goods
- Taxes: Year-end inventory valuation (US GAAP: lower of cost or market, IFRS: lower of cost or net realizable value) changes taxable income.
- Profitability: Misstated inventory values distort COGS and gross margins, making profits look stronger or weaker than they really are
In short, knowing your true inventory value in Shopify helps you manage working capital and measure taxes and profitability with confidence.
How Shopify Tracks and Reports Inventory Value
Shopify gives merchants built-in inventory reports that show how much stock is on hand and what it’s worth at cost.
These reports are mainly used for accounting, tax reporting, and identifying which products tie up the most working capital.
Below are key ones
- Month-end inventory snapshot/value: Shows quantity and cost-based value of available inventory at month-end. Note that “available” excludes committed or incoming stock.
- ABC analysis by product: Classifies SKUs into ABC tiers based on their recent revenue contribution (top 80%, next 15%, and bottom 5%). This helps prioritize restocks and clearance actions
- Average inventory sold per day / Percent of inventory sold / Sell-through rate: Offer insights into sales velocity and inventory turnover
- Days of inventory remaining: Projects how long current stock will last based on recent sales trends
- Inventory adjustments: Log changes made via manual edits, app updates, inventory transfers, or order fulfillment
While these reports provide a baseline view, they also come with limitations that hinder businesses with more complex operations:
- Shopify uses cost value entered manually for each product. It doesn’t account for landed costs like shipping, duties, or supplier discounts.
- Most reports do not update in real-time, making trend analysis or timely tracking harder without manual exports
- Although Shopify supports multiple locations, many inventory values aren’t consolidated automatically. Merchants often need third-party tools for accurate multi-location valuation.
- No support for accounting methods like FIFO, LIFO, or weighted average cost of goods sold, which can be essential for accurate COGS and financial reporting
Shopify gives you a basic snapshot of your inventory value today, but it's limited to cost entries and lacks real-time data or full accounting compliance.
For growing merchants or those needing true landed cost accuracy, multi-location visibility, or standard accounting support (FIFO/LIFO), supplementing Shopify with advanced planning tools like Prediko or ERP systems is essential.
Methods for Calculating Shopify Inventory Value
Following are some of the main methods businesses use to calculate inventory value, along with how they apply in Shopify.
1. FIFO (First In, First Out)
FIFO assumes the oldest inventory is sold first, leaving the most recent purchases in ending stock. This method mirrors how goods physically move in most businesses and is especially important for perishables or fast-moving products.
Shopify doesn’t support FIFO natively, so merchants who need it for accounting or compliance usually depend on third-party integrations or external systems.
2. LIFO (Last In, First Out)
LIFO assigns the most recent inventory costs to sales first, leaving older costs in inventory. This method can lower taxable income during periods of rising prices, which is why some US companies use it.
It is accepted under US GAAP but not under IFRS. Shopify does not support LIFO, so it must be handled entirely through another software.
3. Weighted Average Cost
Weighted average spreads total costs evenly across all units, giving a consistent per-unit cost. It works well for businesses selling large volumes of interchangeable or bulk products where tracking individual purchase costs isn’t practical.
Shopify follows this approach by letting merchants assign a single cost field per product, making it the simplest method to use on the platform.
Which method fits your business best
- FIFO: Reflects actual product flow; ideal for perishables and fast-moving goods
- LIFO: Allowed only under US GAAP; mainly used for tax benefits during inflation
- Weighted Average: Easiest to apply in Shopify; best for bulk or interchangeable products
Finding Your Shopify Inventory Value Step-by-Step
Calculating inventory value in Shopify requires pulling the right reports and exporting data when needed.
Here’s how to do it step by step.
Step 1: Access inventory reports
First, go to Analytics > Reports > Inventory
Here you’ll find reports like the valuation summary, month-end snapshot, and inventory quantity report.
Each one shows stock at cost, which forms the base for inventory valuation.
Step 2: Apply filters
Tailor the reports for accuracy. For example, when preparing month-end accounts, you might
- Filter by product category to include only relevant SKUs.
- Select a specific date (e.g., July 31) to match accounting records
This ensures your totals align with the reporting period and aren’t inflated by unrelated categories or dates.
Step 3: Export to CSV
Once filtered, click Export. The CSV exports are especially useful because
- They can be archived for tax or audit purposes
- Finance teams can cross-check numbers with accounting software
- You can adjust data (e.g., add landed costs) outside Shopify
Unlike viewing reports in Shopify, CSVs give you the flexibility to preserve and manipulate inventory values.
Step 4: Combine multi-location data
If you operate multiple warehouses or POS locations, Shopify won’t automatically consolidate their inventory values. To get a true company-wide number
- Export reports from each location
- Merge them into a spreadsheet
- Sum the totals for a consolidated value
This step avoids the risk of underreporting or double-counting across locations.
Common Mistakes to Avoid During Shopify Inventory Value Calculation
To keep your reporting accurate and your decisions reliable, it’s important to watch out for most common mistakes merchants make when calculating inventory value.
1. Ignoring damaged or obsolete stock
Inventory valuation must reflect the true value of stock on hand, not just the count. If obsolete or damaged goods remain included at full cost, the inventory value looks inflated, and gross margins are distorted.
A real-life example is Hasbro, which admitted it had over-purchased toys during the pandemic.
Much of that stock later became unsellable, and because it wasn’t written down quickly enough, the company’s reported performance didn’t match reality.
The result was a sharp revenue decline and a lawsuit from investors who argued the inventory had been overstated.
2. Using sales price instead of the cost price
Inventory valuation must always be based on the purchase cost, not retail price.
Mixing two leads to overstated assets and distorted margins. This mistake is common when merchants rely on retail-facing reports, which highlight selling price instead of cost.
For accounting purposes, always check that Shopify’s cost field is being used, not the price field.
3. Failing to reconcile multi-location data
When stock is split across warehouses or stores, Shopify reports will only show location-level values. If these aren’t consolidated, totals may be incomplete or double-counted.
A merchant running both online fulfillment and a POS store could easily end up with mismatched values unless exports from each location are merged.
Reconciliation ensures the company reports one accurate figure for inventory across the business.
Using apps such as Prediko to Automate Shopify Inventory Value Calculation
Prediko’s inventory planning and management app is built for Shopify merchants who need accurate and up-to-date inventory valuation without relying on manual exports or spreadsheets.
The app natively syncs with Shopify to track inventory across all products, variants, and locations, so that the valuation reflects current stock levels and costs without manual input.
The updates to your records are made in real time. As transactions occur, Prediko updates the inventory value in its centralized dashboard, showing total value of stock on hand across single or multiple stores.
Here’s a deep dive into how you can automate calculating Shopify Inventory Value with Prediko.
- Automatic valuation across multiple stores: Pulls live data from every Shopify location and consolidates it, giving you a single, accurate company-wide figure without spreadsheets.
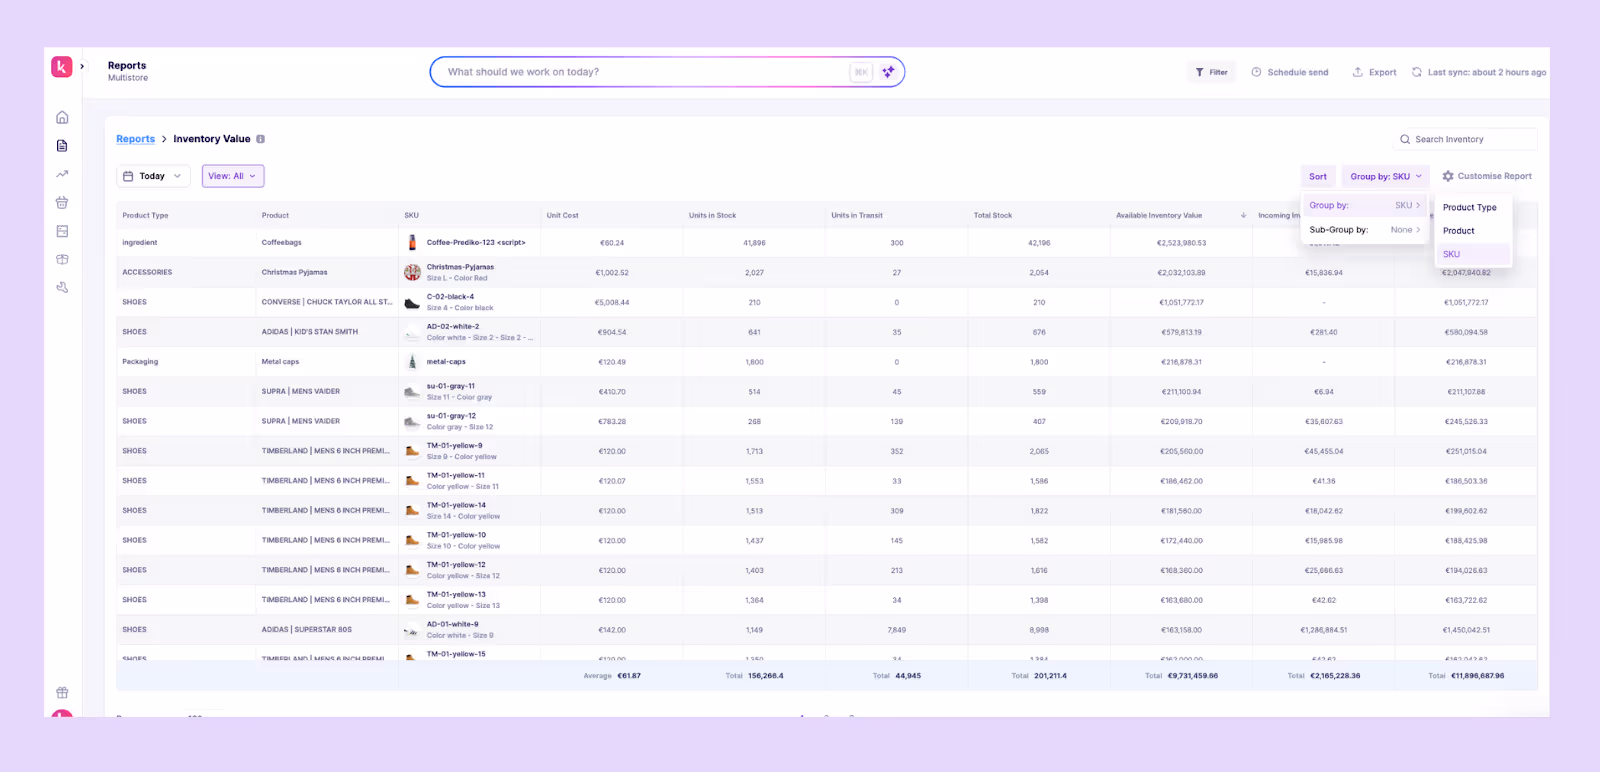
- Real-time dashboard: Tracks inventory value at the SKU and category level, based on units in transit while aligning with current sales velocity and seasonality. Choose to exclude the in-transit inventory.
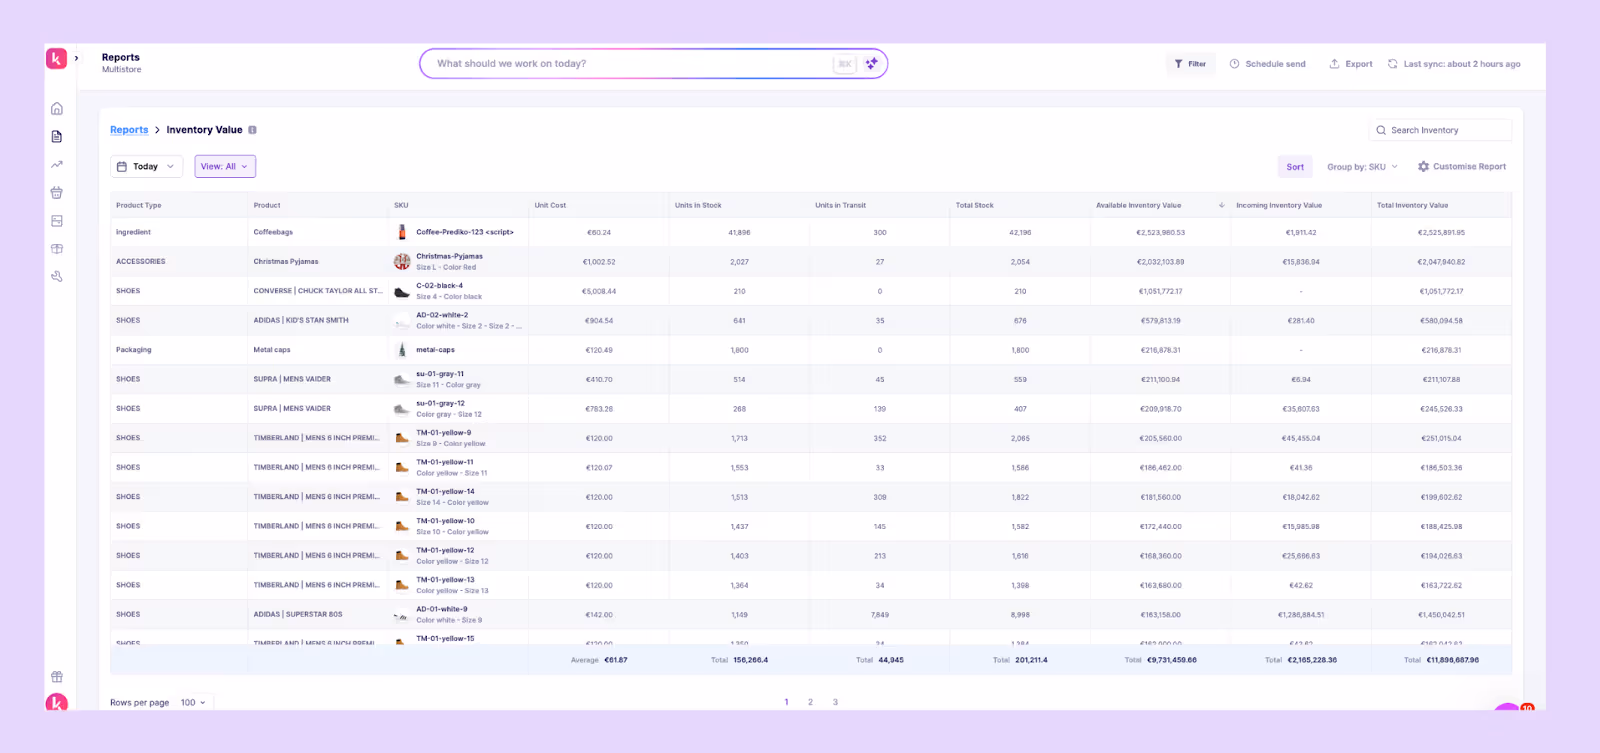
- Advanced analytics and reports: Breaks down valuation by SKU, product type, or location. Provides historical trends so finance teams can see how much capital was tied up in inventory over time, not just today.
- 70+ 3PL and warehouse integrations: Connects directly with logistics partners so stock held outside Shopify is included in the valuation. Ensures landed costs, duties, and freight are reflected in the numbers, not ignored.

Prediko turns inventory value from a static report into a live financial metric, helping merchants reconcile faster, make better cash flow decisions, and avoid overstating or understating stock in the books.
Get Inventory Value Right, Every Time
Inventory value shapes cash flow, taxes, and profitability, but it’s easy to get wrong if you rely only on static reports or manual calculations.
Accurate valuation means knowing the true cost of your stock at any moment, across all locations.
Prediko gives you that visibility. It automates inventory valuation, consolidates data from warehouses and 3PLs, and updates dashboards in real time so you can see exactly how much working capital is tied up in stock and act on it immediately.
Start your 14-day free trial and see how Prediko makes Shopify inventory value clear, accurate, and always up to date.
Frequently Asked Questions (FAQs)
How To Find Direct Materials Used by Shopify D2C Brands [Formula + App]
Learn the formula to calculate the amount of Direct Materials used by Shopify D2C Brands.
What is Direct Materials
In a typical manufacturing process, it’s important to understand the cost of ingredients or components. That’s why in the manufacturing world, these ingredients are referred to as "raw materials” or direct materials.
But how can Shopify brands measure and understand the cost associated with these materials? That’s what we get to learn from the direct materials used formula and related calculations in a simple-to-understand way.
Formula for Direct Raw Materials
The Direct Material Cost Formula is pretty straightforward. You need to start with the amount of materials you had at the beginning of a period called Beginning Inventory. Then you need to add purchases made during that period and subtract the materials left over at the end, i.e., Ending Inventory.
This calculation provides you with the total amount of Direct Materials utilised in your production, which directly feeds into your cost of goods manufactured.
It calculates the total cost of materials actually used in producing goods. Jumping straight into the exact formula:
Direct Material Cost = Beginning Inventory + Purchases during the period - Ending Inventory
Consider an apparel store on Shopify that begins the month with $10,000 worth of fabrics and other materials as its Beginning Inventory. During the month, it purchases an additional $7,000 worth of materials. By month's end, the store has $4,000 worth of materials left as Ending Inventory.
Using the Direct Material Cost Formula:
Direct Material Cost = $10,000 (Beginning Inventory) + $7,000 (Purchases during the period) - $4,000 (Ending Inventory) Direct Material Cost = $13,000
This calculation reveals that the apparel store used $13,000 worth of materials in crafting its products throughout the month. Such calculations are generally done automatically in the best clothing inventory management tools and software.
This formula helps businesses understand the actual cost of materials consumed in the production process.
Interpreting the Value for Direct Materials Used & Applying For Your Brand
Understand & apply the Direct Raw Materials Used Formula allows a company to accurately track the cost associated with the production materials.
This information is helpful for:
- Knowing exact cost of raw materials used in production helps in setting up product prices.
- Budgeting: Predicting future raw material requirements and their costs.
- Assessing the raw material cost components as part of an overall inventory management strategy.
Prediko simplifies this calculation for Shopify D2C Brands
Prediko's Raw Material Planner allows you to set up or import your raw materials as well as your bill of materials (BOM) into Prediko within minutes.
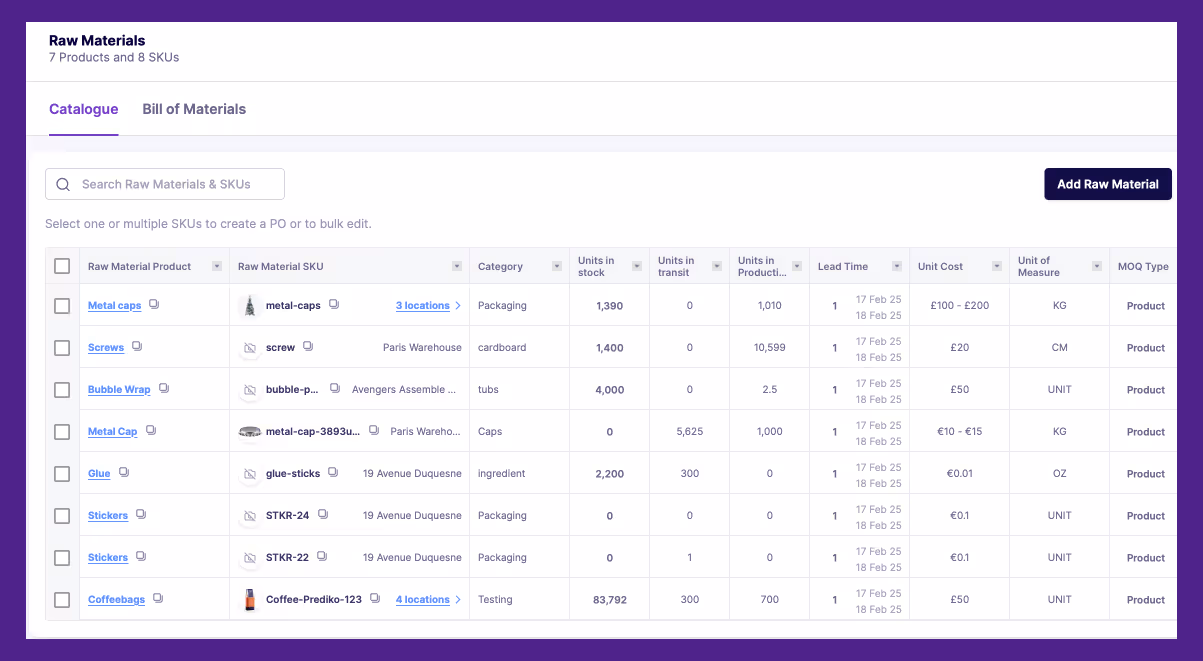
Once your raw materials and BOM are uploaded, you can then create production orders that contain those raw materials and sent them to your suppliers.
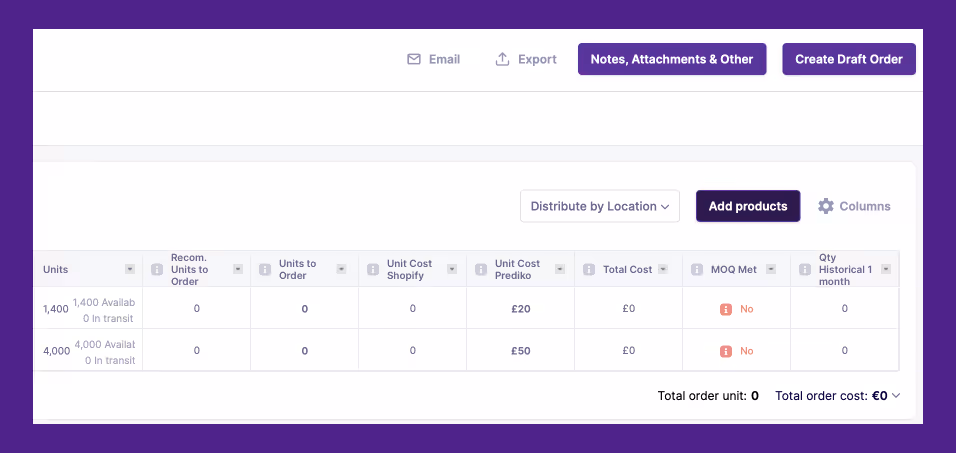
Prediko tracks the usage of raw materials in production dynamically as you create production orders within the system and gives you alerts on when you need to reorder which raw materials to guarantee continued finished good production. We have also written a detailed guide on how to start with raw materials inventory management.
Three Methods to Calculate Direct Material Cost: FIFO, LIFO & Weighted Average
Beyond simply calculating direct material costs, businesses can apply different inventory valuation methods to track the cost of raw materials consumed. The three common approaches are:
1. FIFO (First-In, First-Out)
Under the FIFO method, the earliest (oldest) inventory purchased is used first. This means that raw materials bought first are the first ones to be consumed in production.
- Best for: Businesses that want to ensure older stock is used first, reducing waste and aligning with natural inventory flow.
- Example: If a Shopify brand purchases 100 units at $5 each and later buys 100 units at $7 each, FIFO assigns the cost of production based on the older $5 units before using the $7 ones.
How to apply the FIFO method to raw material costs
2. LIFO (Last-In, First-Out)
Under LIFO, the most recently purchased inventory is used first, meaning the newer stock gets used up before the older stock.
- Best for: Businesses operating in inflationary markets where prices rise over time. LIFO results in higher costs, reducing taxable income.
- Example: If the latest batch of materials cost $7 per unit and the older batch cost $5 per unit, LIFO assumes the $7 materials are used first, increasing the cost of goods sold (COGS).
How to apply the LIFO method to raw material costs
3. Weighted Average Cost (WAC)
The Weighted Average Cost method calculates a new average cost per unit after each purchase, distributing the total cost of materials evenly across inventory.
- Best for: Businesses looking for a simple and consistent valuation method, especially when prices fluctuate.
- Example: If a brand purchases 100 units at $5 each and another 100 units at $7 each, the WAC per unit would be:
- ($5 × 100 + $7 × 100) ÷ 200 = $6 per unit
Each unit is then valued at $6, balancing cost fluctuations over time.
Why Does This Matter?
Choosing the right method impacts:
- Profitability: LIFO increases cost of goods sold (COGS) in times of rising prices, reducing taxable income, while FIFO lowers COGS, boosting profits.
- Tax implications: Different accounting rules apply to each method, so Shopify brands must ensure they comply with tax regulations.
- Inventory strategy: FIFO helps maintain fresh stock, while LIFO may be beneficial in certain cost-cutting strategies.
See how Leading eCommerce brands mastered their Shopify inventory with Prediko,
- Healf Achieved 75x ROI by Reducing Stockout
- How Obsidian Piercing Increased Best Seller Revenue by 200%
- How Kate Hewko boosted Inventory Efficiency by 40%