

Picture running an online store where some products ship out the same day they’re stocked, while others sit in the warehouse for weeks waiting for a buyer.
Fast movers keep cash flowing back into your business, but the slow ones quietly lock up money and space.
That’s the balance of Days Sales in Inventory (DSI) measures, and managing it is no easy task.
We’ll explain how to calculate DSI, what the number really means, and how to keep it under control with the right tools and strategies.
What is Days Sales in Inventory (DSI)?
Days Sales in Inventory (DSI) measures how many days, on average, it takes for a business to sell its inventory. The formula to calculate it is
DSI = (Average Inventory ÷ Cost of Goods Sold) × No. of days (commonly 365 days)where
- Average Inventory = (Beginning Inventory + Ending Inventory) ÷ 2
- COGS = Cost of Goods Sold during the period
A lower DSI indicates faster inventory turnover and better cash flow, while a higher DSI suggests stock is sitting longer, tying up working capital and increasing the risk of obsolescence.
Why is Days Sales in Inventory Important?
Days Sales in Inventory (DSI) isn’t just a number; it’s a window into how efficiently your business manages stock. For Shopify merchants, understanding DSI is critical because it
- Impacts cash flow: Reveals how quickly cash tied up in inventory returns to the business
- Drives working capital efficiency: A lower DSI frees up cash for daily operations or growth initiatives
- Highlights risk: A higher DSI increases chances of obsolescence, markdowns, or costly write-offs
- Affects profitability: Longer holding periods raise carrying costs and may require extra financing.
How to Calculate Days Sales in Inventory (Step-by-Step)
We’ve put together a simple step-by-step process to help you calculate Days Sales in Inventory.
Step 1: Determine average inventory
Average inventory is calculated by taking the sum of opening inventory and closing inventory for the period, then dividing by two.
This smooths out fluctuations and gives a more representative value than using a single date.
Formula
(Opening Inventory + Closing Inventory) ÷ 2
Step 2: Calculate cost of goods sold (COGS)
Next, find out the cost of goods sold for the same period. COGS includes the direct expenses of producing or purchasing the products that were sold, such as raw materials and direct labor.
It should not include overhead costs like marketing or distribution. Using the matching period aligns the numerator (inventory) and the denominator (COGS), helping to produce an accurate metric.
Step 3: Select period length
The most common period length used in DSI is 365 days, which gives an annual view of inventory efficiency.
However, companies may also calculate DSI for a quarter (90 days) or a month (30 days) to monitor performance more closely.
The choice depends on reporting needs, but consistency is critical so comparisons across periods are valid.
Step 4: Apply the Days Sales in Inventory formula
Now apply the formula.
DSI = (Average Inventory ÷ COGS) × Period LengthLet’s say
- Annual COGS = $1,000,000
- Average inventory = $150,000
Then, DSI = (150,000 ÷ 1,000,000) × 365 = 54.75 days
This means it takes the company almost 55 days, on average, to sell its inventory. If DSI is reduced to 45 days, the amount of working capital freed is:
(54.75 − 45) ÷ 365 × 1,000,000 = $26,712
That is nearly $27,000 of cash released back into operations without any increase in sales or reduction in costs.
Variants of DSI calculation
The standard formula works for most cases, but different industries and reporting needs often require adjustments. Some of the common variations include.
- Using ending inventory instead of average inventory for a quick snapshot, though it can distort results if inventory levels fluctuate seasonally
- Calculating DSI at retail prices rather than cost, which may be useful for merchandising reports but inflates the ratio and is less accurate for financial analysis
- Including work-in-progress (WIP) inventory in manufacturing, where partially completed goods are a large part of total stock
- Calculating DSI separately for each warehouse or distribution center to identify where inventory is slower to move
- Measuring DSI at the SKU level to reveal problem products, rather than only tracking the company-wide average
These variations provide flexibility depending on the question being asked, but for financial reporting and benchmarking, the average inventory and COGS method remains the most reliable.
What are the Common Pitfalls of Days Sales in Inventory Calculation?
While Days Sales in Inventory (DSI) is a powerful metric, it’s easy to miscalculate or misinterpret.
Here are some common pitfalls to watch out for:
1. Using inaccurate or inconsistent sales data
A frequent mistake is relying on sales data from a period that does not reflect normal activity. For example, calculating DSI using only peak-season sales will make inventory appear to move faster than it usually does.
On other hand, using only off-season data may exaggerate how long stock sits. To avoid skewed results, the calculation should be based on a full year or an average of comparable periods.
2. Including non-sellable or reserved stock
Another error is including items that cannot actually be sold. Damaged goods, products awaiting return to suppliers, or inventory reserved for specific customer orders inflate the reported stock figure without representing real sellable units.
Even in-transit goods may distort results if they are counted before they are available to fulfill demand. The purpose of DSI is to measure how quickly inventory converts to sales, so only items available for sale should be included in the calculation.
3. Ignoring returns or cancellations
Returns and order cancellations are often overlooked when calculating DSI, but they directly reduce the effective volume of goods sold. If they are excluded, COGS is understated and DSI looks better than it really is.
In industries with high return rates, such as fashion or electronics, the impact can be significant.
Adjusting for returns and cancellations ensures that the days sales in inventory ratio reflects true sales performance rather than just gross shipments. This gives a more realistic picture of how quickly inventory is being cleared.
What is a “Good” Days Sales in Inventory (DSI)?
There is no single number that defines a good DSI because turnover speed depends heavily on industry, product type, and supply chain model.
A grocery store must move stock in days, while a luxury brand can hold items for months without issue. The key is to compare DSI against peers in the same sector and to track trends over time within the business.
A “good” DSI is one that reflects efficient inventory turnover relative to industry standards while supporting product availability and customer demand.
DSI vs DIO vs Inventory Turnover
Days Sales in Inventory (DSI), Days Inventory Outstanding (DIO), and Inventory Turnover all measure how efficiently inventory is managed. The terms DSI and DIO are often used interchangeably, while inventory turnover provides the inverse view.
In practice, DSI and DIO are two names for the same metric, while inventory turnover flips the perspective to show how many cycles occur in a year. Lower DSI and higher turnover generally indicate faster movement of goods.
Why do Days Sales in Inventory Change Over Time
DSI is not a static figure. It shifts with changes in demand patterns, supply chain conditions, and pricing strategies. Understanding the drivers behind those shifts helps explain whether the change is healthy or a signal of risk.
- Seasonality: Holiday peaks and off-season slowdowns naturally cause swings in inventory holding periods, affecting DSI
- Promotions: Discounting or clearance sales can temporarily lower DSI as stock sells faster
- SKU proliferation: Adding more product variants increases complexity and can slow turnover if demand is spread between the products
- Forecast error: Overestimating demand drives up excess stock, while underestimating causes shortages, both of which can distort your DSI
- Supplier lead times: Longer or unpredictable lead times force merchants to keep higher safety stock, raising DSI
- Manufacturing batch sizes: Large production runs may keep inventory high until sales catch up
- Returns and quality issues: High return rates or rejected goods lengthen the time inventory sits before reselling or disposal
Managing Days Sales in Inventory Effectively
Lowering DSI requires a mix of immediate actions and long-term process improvements. A practical way to approach it is by phasing actions over different time horizons. Here is how companies can structure their efforts.
Quick wins (first 30 days)
- Identify top 20 SKUs that contribute most to excess inventory and take targeted action
- Run promotions or bundles to clear slow-moving stock without heavy margin losses
- Re-evaluate your reorder points and go for demand-driven replenishment so that you reorder based on actual demand
Medium horizon (around 60 days)
- Negotiate shorter lead times with suppliers to reduce the need for high safety stock
- Set safety-stock levels by SKU instead of blanket rules to avoid unnecessary holding costs
- Adjust manufacturing or purchase lot sizes so that inventory does not accumulate in bulk
Deeper changes (around 90 days)
- Implement automated replenishment apps and solutions to reduce manual errors in ordering
- Align purchasing cadence more closely with demand signals from sales data and forecasts
Longer-term strategy (6–12 months)
- Invest in better forecasting methods like AI-powered forecasting models to anticipate demand with higher accuracy
- Explore vendor-managed inventory arrangements to shift stock responsibility upstream
- Apply multi-echelon inventory optimization (distribute stock where it’s needed most) across warehouses or regions to balance inventory efficiently
- Establish strong data governance so inventory numbers are reliable and actionable
How Prediko Helps Optimize Days Sales in Inventory
Prediko is built to shorten inventory holding periods by aligning purchasing and stock levels with actual demand.
With its AI-powered inventory planning and management, Shopify brands can cut excess stock, prevent shortages, and lower their DSI, all while keeping product availability high.
Here’s how its features make that possible.
- AI demand planning: Prediko forecasts future demand using historical sales, seasonality, and growth trends so businesses order the right quantities at the right time. This reduces overstocking and stockouts that skew DSI.
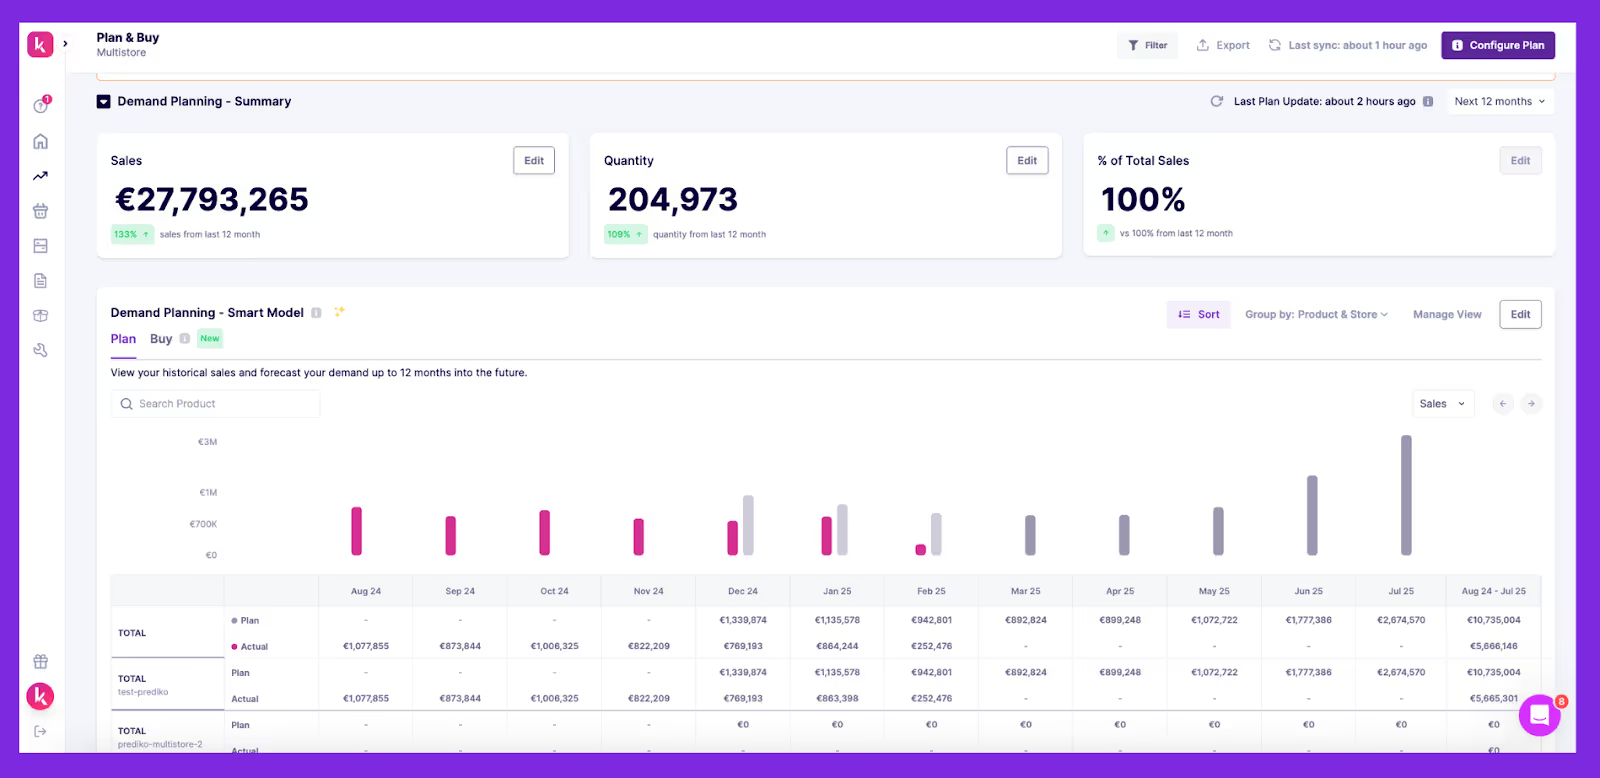
- Buying plan and purchase order automation: The platform automatically creates buying plans and generates purchase orders based on real-time demand. This smarter approach to purchasing keeps inventory flowing steadily instead of piling up, helping reduce DSI.
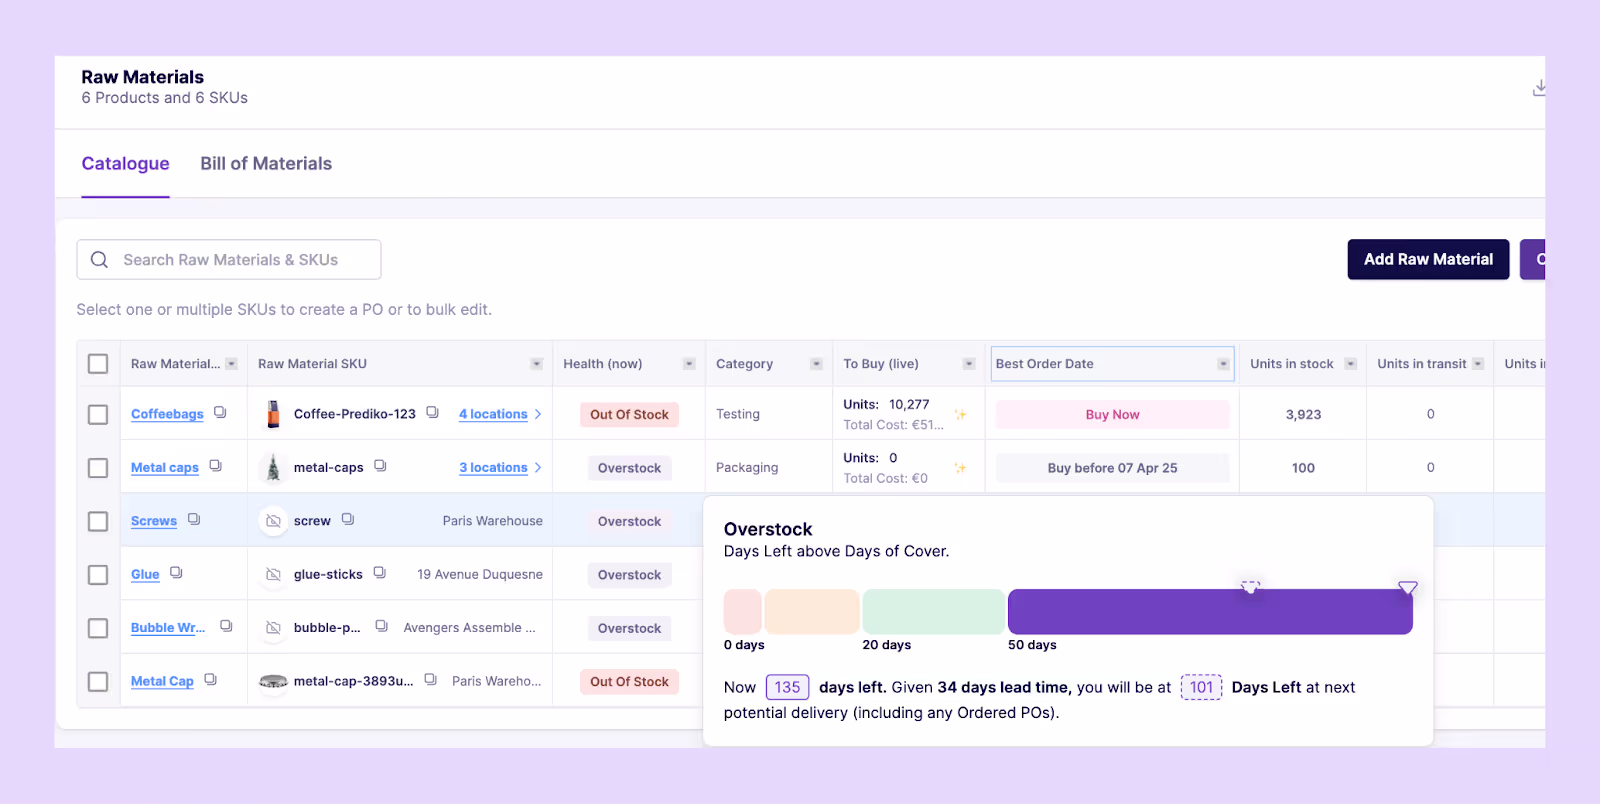
- BOM and raw materials management: For manufacturers, Prediko tracks and forecasts raw materials.
You can also create bills of materials (BOMs) for finished goods. This visibility prevents production delays and excess component stock, keeping inventory cycles tighter.
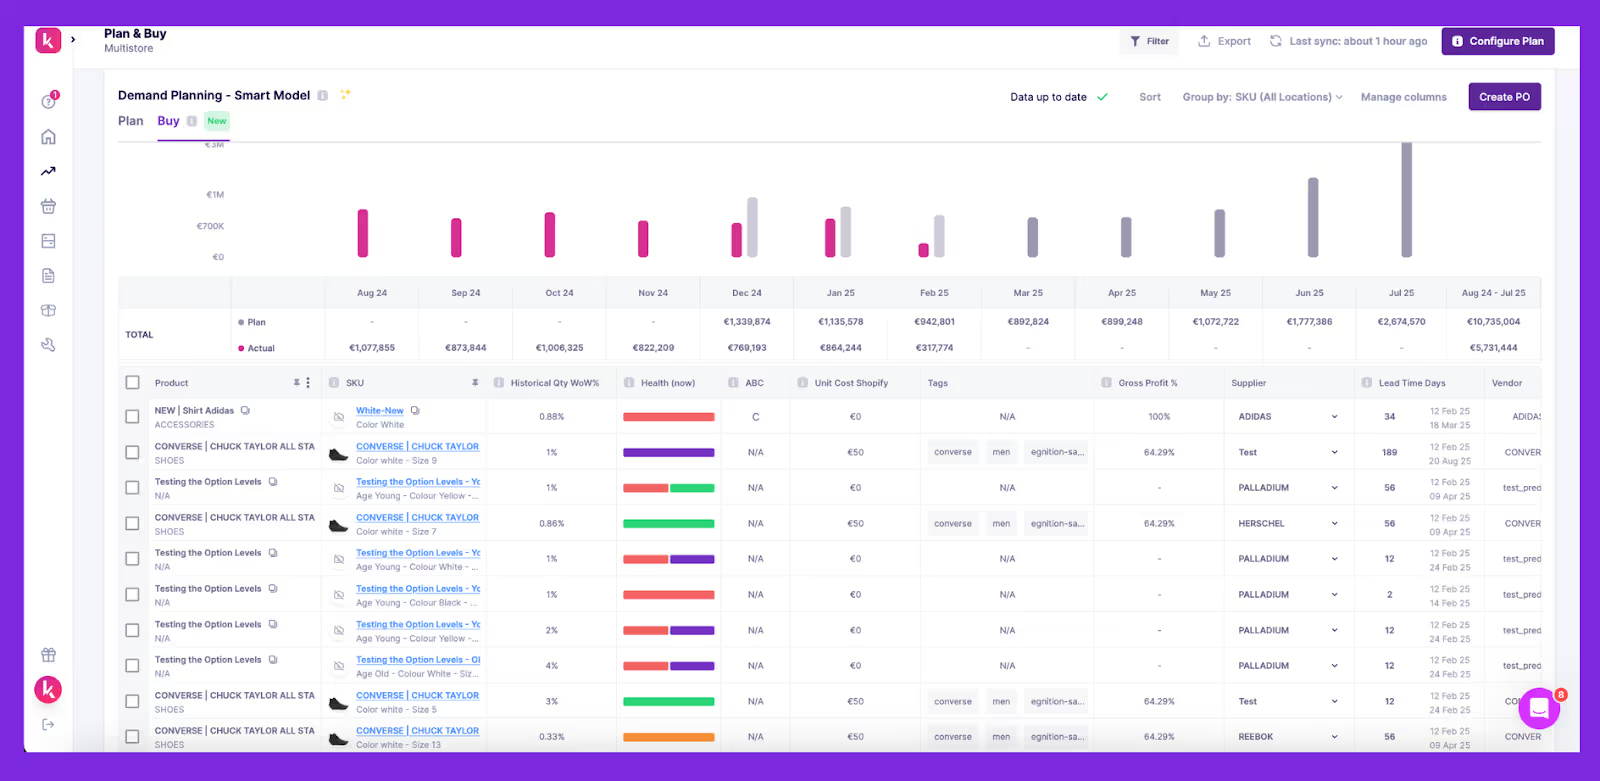
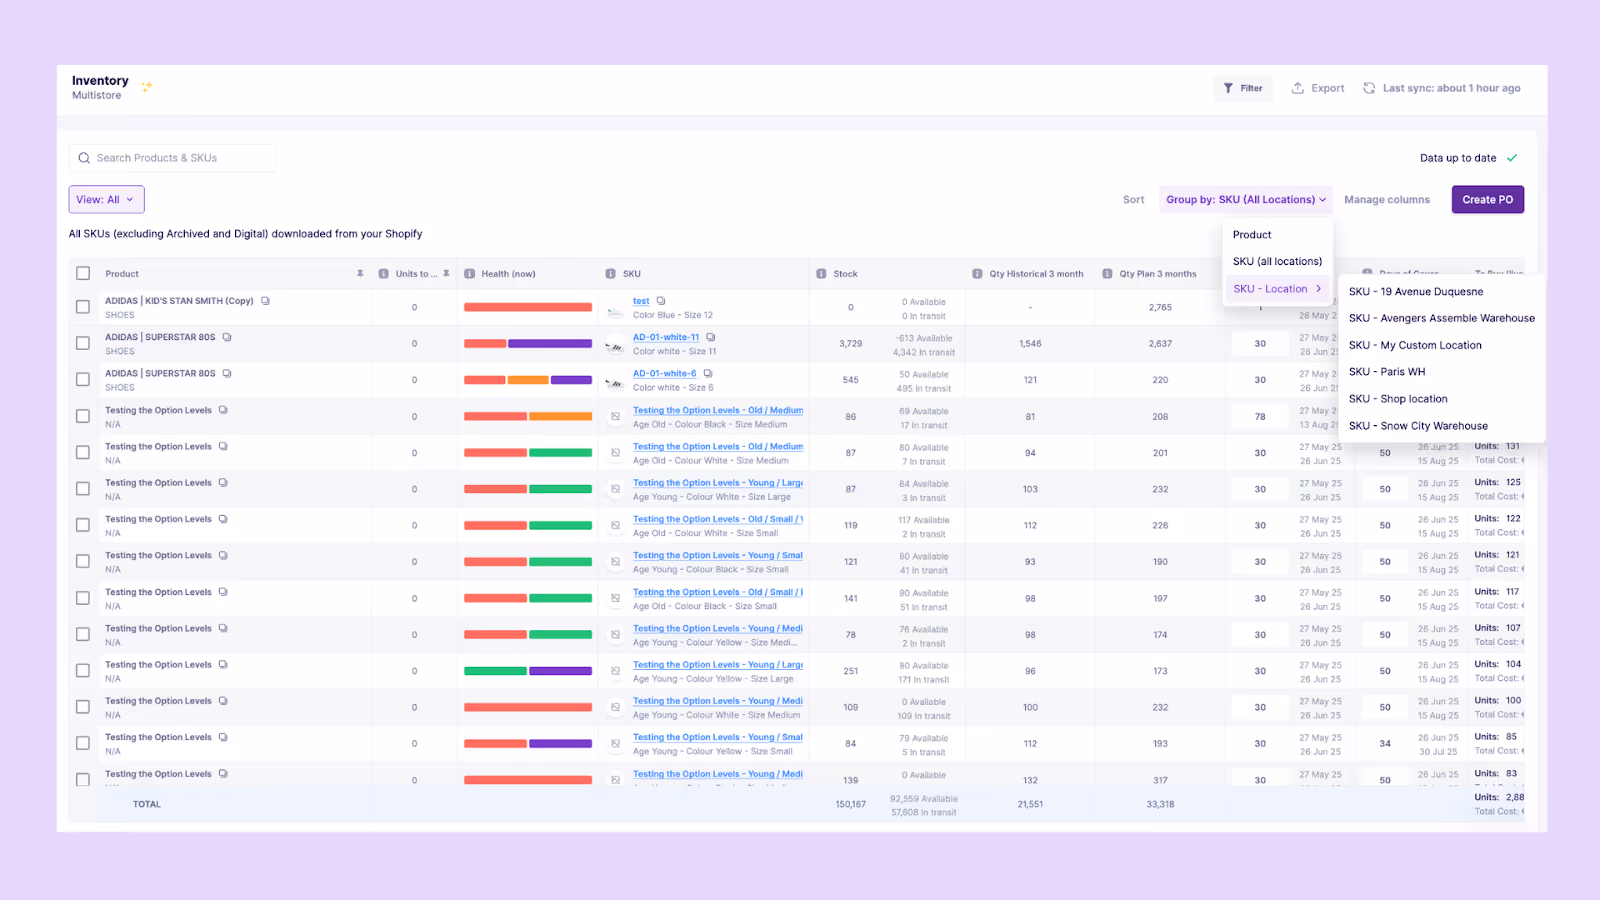
- Multi-store and warehouse visibility: For Shopify brands with multiple locations, Prediko provides a single view to track and manage stock across all warehouses and stores. This makes it easier to balance inventory between locations, reducing slow-moving stock that drives DSI up.
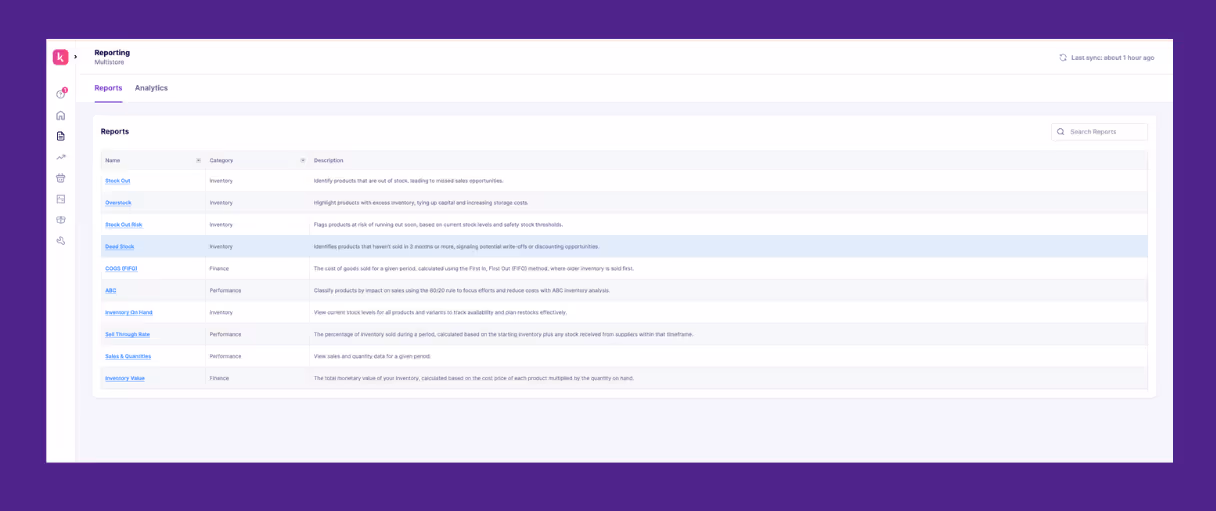
- Analytics and reporting: Prediko offers 10+ report templates and analytics with insights on SKU-level performance, stockout costs, overstocks, and sell-through rates. This data helps teams act quickly to clear bottlenecks and sustain a healthy inventory turnover.
How to Report DSI to Stakeholders
When sharing DSI with stakeholders, the goal is to make the number easy to interpret and tie it to business impact.
Instead of presenting a single figure, use visualizations that highlight trends and problem areas.
Here are some effective methods to report it.
- Rolling 12-month DSI trend line to showcase improvement or deterioration over time
- SKU heatmap so that stakeholders can identify products that are driving excess holding
- Cohort charts to compare the performance of new product launches versus older ones
- Cash conversion cycle (CCC) dashboard linking DSI with DSO and DPO for a full working capital view
Keep Days Sales in Inventory Under Control
Days Sales in Inventory is a key metric that shows whether your inventory is fueling growth or tying up capital.
By calculating it correctly, benchmarking against your industry, and acting on the drivers of change, you can free up working capital while still meeting customer demand.
Prediko gives you everything to take control of DSI, from AI demand planning to real-time purchase order management and multi-location visibility.
With the right systems in place, inventory stops being a drain on cash flow and becomes a lever for growth.
Start your 14-day free trial and see how Prediko helps reduce DSI with its smart features.