

Most Inventory reports have not kept up with the times and are outdated in terms of data.
For many teams, reporting is still spread across spreadsheets, delayed by exports, and full of static numbers that don’t explain what’s really happening.
This keeps operations stuck in reactive mode: chasing stockouts, justifying overstocks, and cleaning up errors after they’ve already caused damage.
AI inventory reports change that. They bring real-time visibility, intelligent forecasting, and actionable insights into one place.
We break down what AI inventory reporting is, how it works, and the essential reports Shopify stores shouldn’t operate without.
What are AI Inventory Reports and How Do They Work?
AI inventory reports automatically track, analyze, and forecast inventory performance.
Unlike static spreadsheets or manual exports, they learn from past data in real time, highlight issues, and suggest actions.
Here’s how a typical AI inventory reporting platform works
- Pulls real-time data from Shopify, Amazon, WMS, ERPs, and other sources
- Ingests and cleans information to ensure accuracy across systems
- Runs ML models or algorithms to identify trends, outliers, and demand forecasts
- Generates visual reports (tables, charts, alerts) by SKU, location, vendor, or channel
- Triggers operational workflows such as PO generation, transfers, etc
Remember, free AI inventory reports can be a good starting point, but they’re typically limited compared to tools that automate reporting and insights in real time.
Key Features of AI Inventory Reports
AI inventory reports go beyond static dashboards; they continuously update, highlight risks, and surface actions. Some of the common features include:
1. Predictive demand insights
Reports include forward-looking demand insights and forecasts, factoring in trends, seasonality, and recent sales patterns. This helps teams plan inventory based on expected demand, not just past performance.
2. Automated insights and alerts
Instead of manually digging through data, AI reports highlight what needs attention: low stock risks, excess inventory, or unusual demand changes, and suggest next steps.
4. Granular performance tracking
AI reports do granular analysis, breaking down performance at the SKU level: fast movers, slow movers, and dead stock, so teams can make better buying, discounting, or discontinuation decisions.
5. Real-time, unified view
Inventory data across warehouses, stores, and channels is consolidated into one view, ensuring decisions are based on current, accurate information.
6. Interactive and conversational access
Some inventory systems allow teams to query inventory in plain language and get instant answers without navigating complex dashboards.
💡Prediko offers an AI agent that enables this, making it easier to access insights and take action quickly.
7. Action-focused dashboards
AI dashboards are built around key inventory metrics like stock levels, turnover, and sell-through, but more importantly, they surface actions, which sometimes can be executed directly from the report.
Benefits of Using AI Inventory Reports
Below are the key benefits businesses and ecommerce stores see when they switch to AI-powered inventory reporting.
1. Improved data accuracy and speed
AI tools automatically pull and update inventory data from ecommerce platforms like Shopify, Amazon, and ERPs.
This reduces errors from manual entry and gives your team faster access to reliable numbers, whether you're checking stock levels, reconciling SKUs, or validating supplier deliveries.
2. Cost savings
With accurate and timely reports, you avoid overstocking, stockouts, and last-minute reorders. This directly reduces carrying costs, shipping expenses, and lost revenue. You also save time spent on manual audits and corrections.
3. Efficient planning and stock optimization
AI inventory reports highlight what’s changing, like shifts in demand, PO delays, or SKU-level returns, so you can act early. This improves planning and helps your team reorder the right items at the right time for your business.
4. Scalability and automation
As you grow, AI systems can handle increasing SKUs, sales channels, and warehouses without added manual work or headcount.
You can easily keep pace by automating analysis, detection, and reporting so that scaling doesn’t come at the cost of accuracy or visibility.
While many teams rely on AI inventory report templates, they’re often limited. Whereas, modern tools automate this entirely, removing the need for manual reporting.
What Makes AI Inventory Reports Better than Traditional Reports
Unlike traditional inventory reports that simply present raw data, AI-powered reports actively interpret and respond to it.
Below are the key differences that make AI inventory reports more actionable and reliable.
1. Automated insight generation
Traditional reports rely on manual data pulls and spreadsheets, requiring teams to dig through rows and apply formulas for basic insights.
In contrast, AI reports automatically analyze incoming data and flag issues (like unusual stock movement or demand spikes), delivering instant visibility without extra effort.
2. Offers recommendations, not just data
Where traditional reporting ends at raw numbers, AI reports go further by offering next steps.
For example, they might suggest a reorder quantity or highlight which POs are late, helping teams act faster, rather than analyze after the fact.
3. Pattern recognition at scale
Manual tools can miss larger trends or channel-specific issues.
AI reports process data across platforms and timeframes, surfacing patterns like seasonal spikes or inconsistent supplier performance that would otherwise go unnoticed.
4. SKU-level reporting accuracy
Traditional methods often suffer from mismatched SKUs, duplicate entries, or outdated counts.
AI systems pull directly from platforms like Shopify, Amazon, and WMS to deliver consistent, real-time SKU-level accuracy across the board.
5. Real-time recalibration with new data
Unlike static traditional reports, AI dashboards adjust automatically as orders, returns, or stock changes happen. This way, your decisions are based on the latest data, not numbers that are already stale.
6. Ability to simulate scenarios
Scenario planning with spreadsheets is slow and error-prone.
AI reports allow you to simulate changes in demand or lead times instantly, helping you prepare for what could happen next instead of just reacting to what happened.
AI Inventory Reports Vs Traditional Reports
Types of AI Inventory Reports
Each AI inventory management report gives you a different lens into how your products move, where you’re exposed, and what needs your attention now versus later.
Below is a breakdown of the essential AI inventory management reports examples, what they cover, and how they help your team operate with more clarity and confidence.
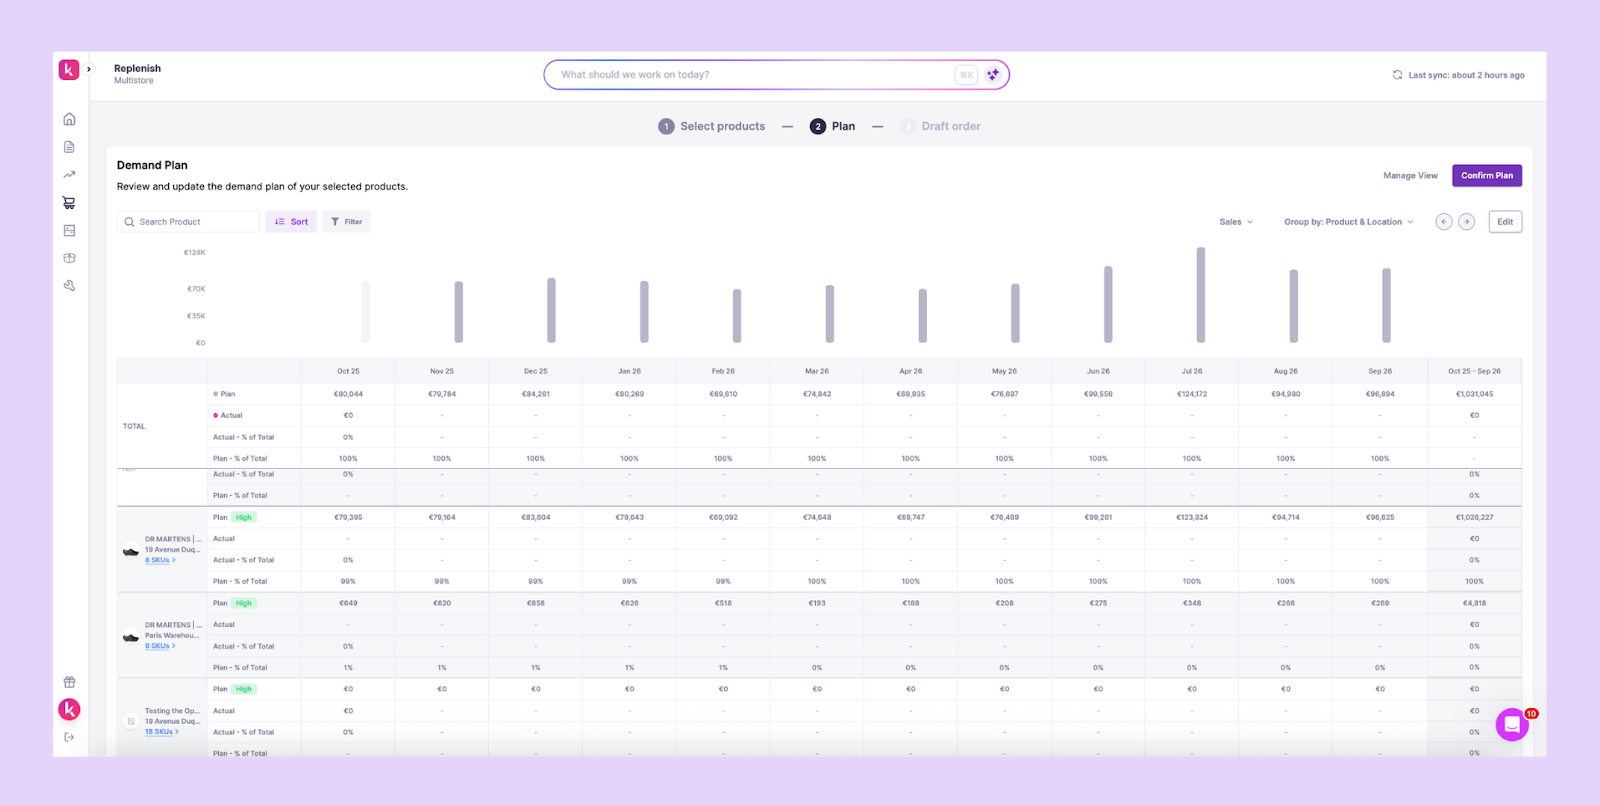
1. Sales & Quantities Report
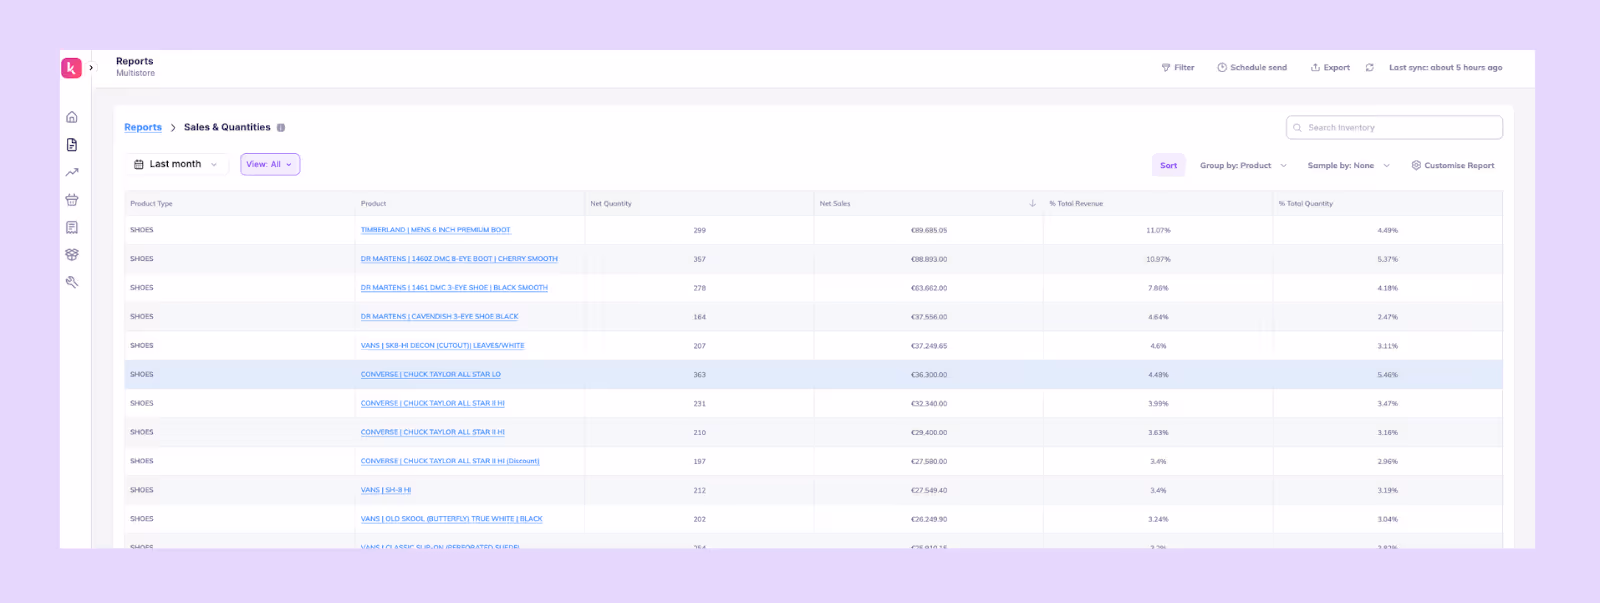
What it is: This report gives you a real-time view of how each SKU is selling, using AI to detect demand patterns and velocity shifts earlier than manual reporting.
How it helps: Helps you understand which products are accelerating, slowing down, or behaving unusually so you can adjust forecasts, production plans, or marketing before trends fully form.
What it includes: Net quantity, Net sales, % Total quantity, and % of Total revenue
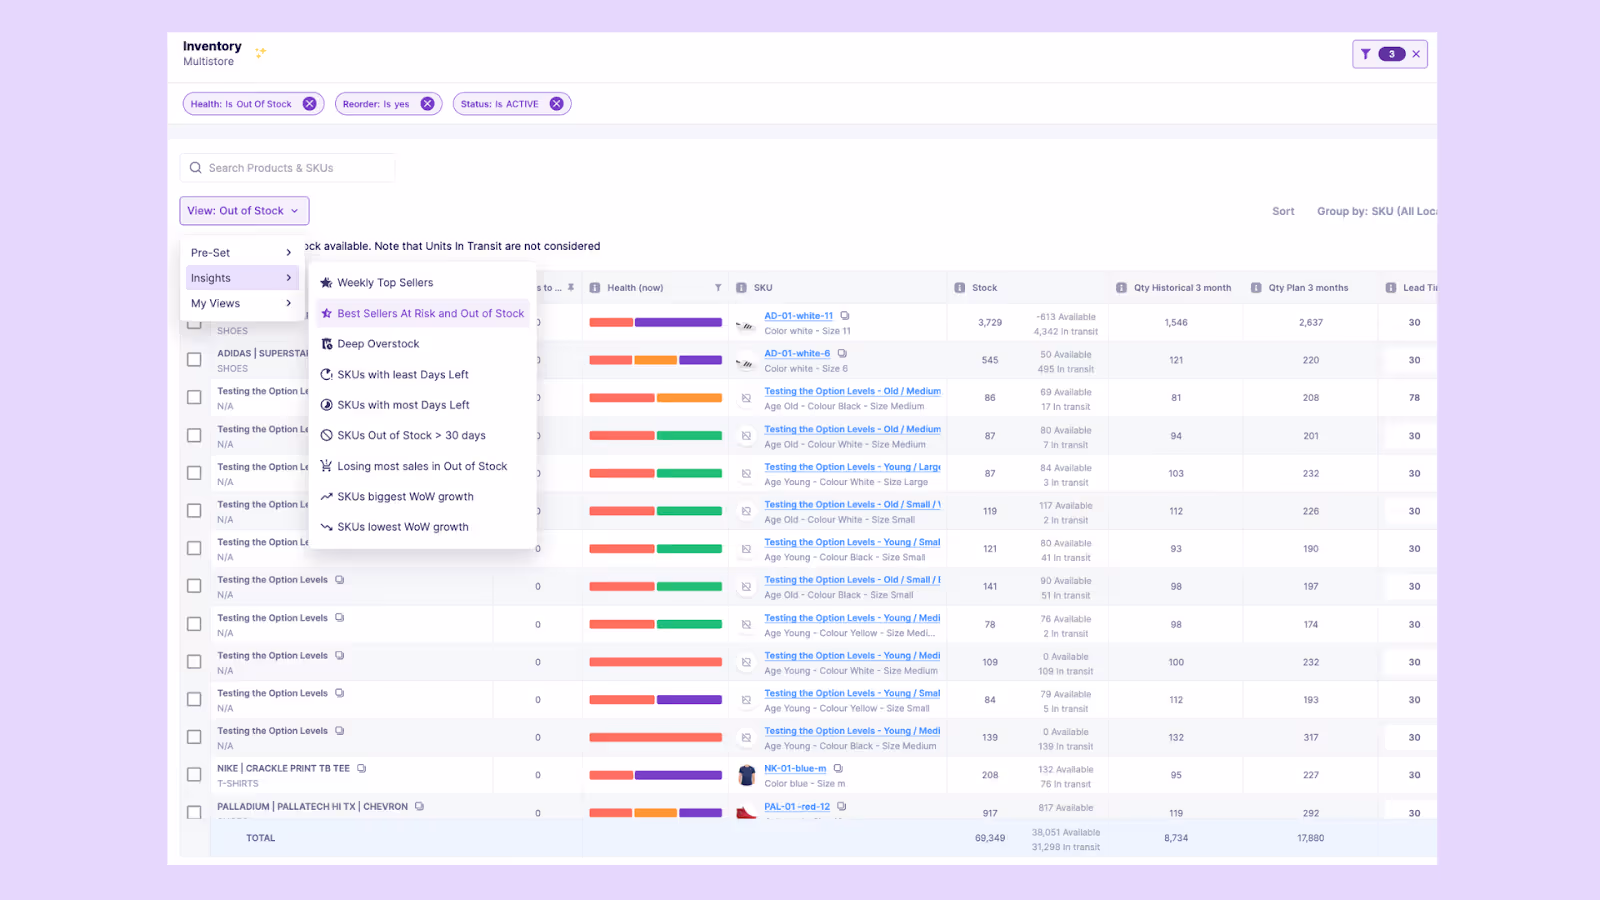
2. Stock Out Report
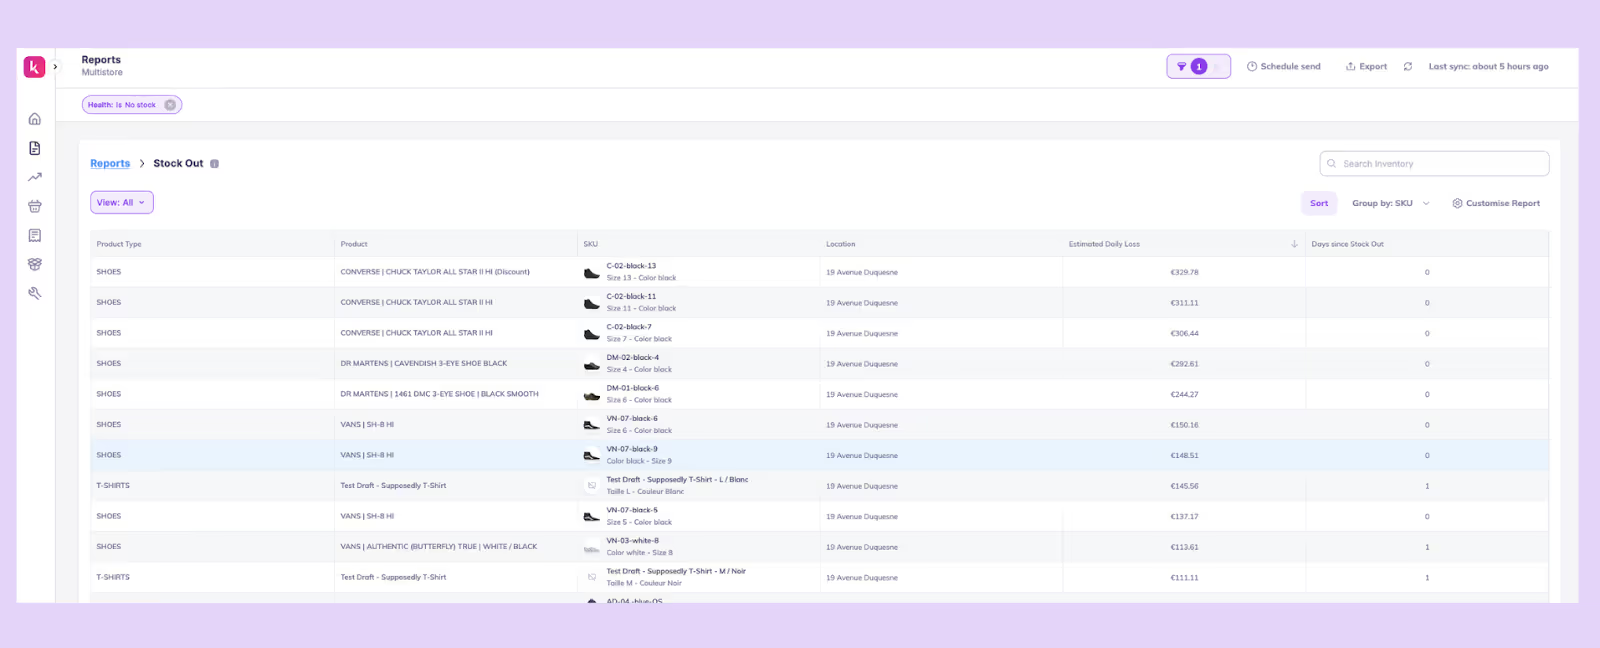
What it is: This is a report showing all products that have hit zero inventory, with AI estimating the impact and prioritising what needs attention first.
How it helps: It alerts you about the immediate revenue loss, helps you pause ads or update product pages, and guides urgent replenishment decisions.
What it includes: SKUs at 0, Location, Days since stock out, and Estimated daily loss.
3. Overstock Report
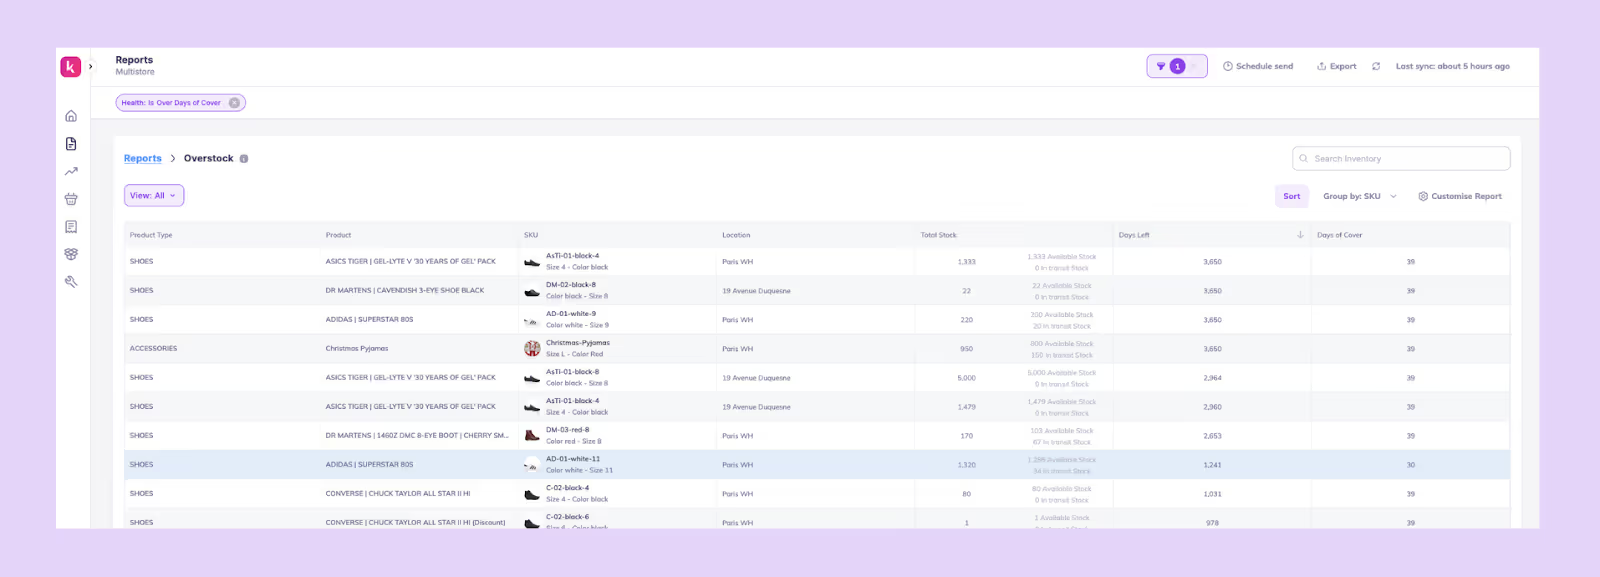
What it is: This AI inventory management report template gives you a view of SKUs with more inventory than demand requires, using AI to detect slow movers and future overstock risks before they pile up.
How it helps: Helps you reduce carrying costs, plan discounting or bundles, and prevent dead stock by catching the problem early.
What it includes: SKU, Location, Total stock, Days left, and Days of cover.
4. Stock Out Risk Report
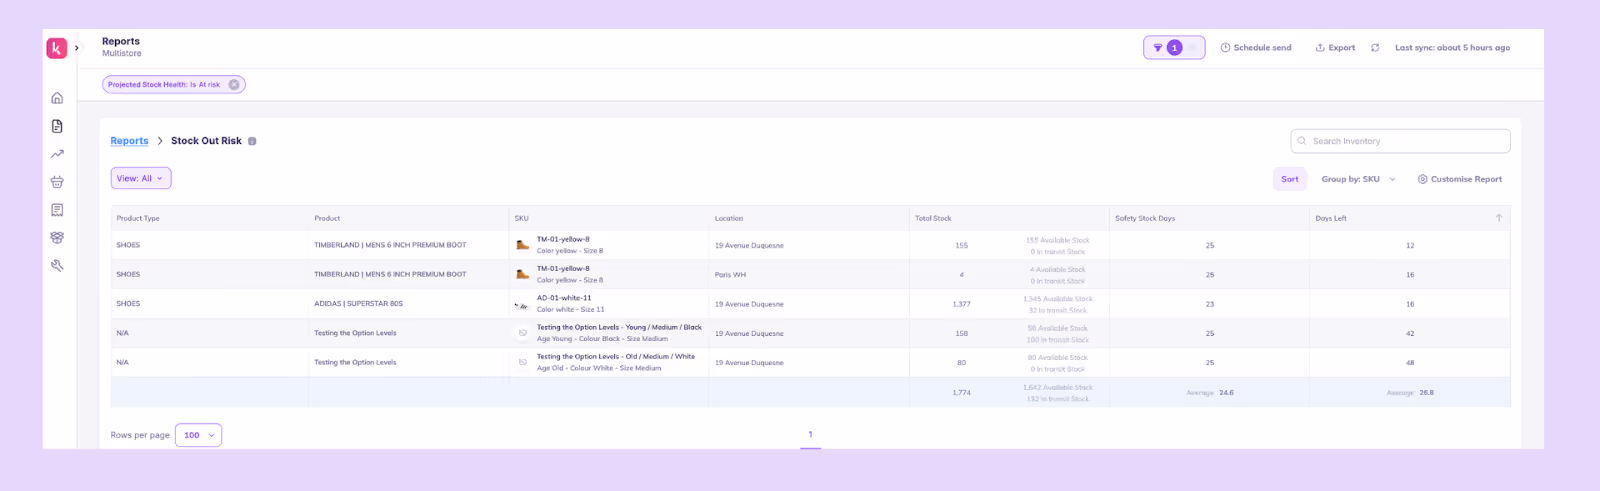
What it is: This report is an AI-powered prediction of which SKUs are likely to run out soon, even if they currently appear “safe.”
How it helps: Gives you advance warning so you can place timely POs, adjust safety stock, or transfer inventory between locations before stockouts happen.
What it includes: SKU, Location, Total stock, Safety stock days, and Days left.
5. COGS (FIFO) Report
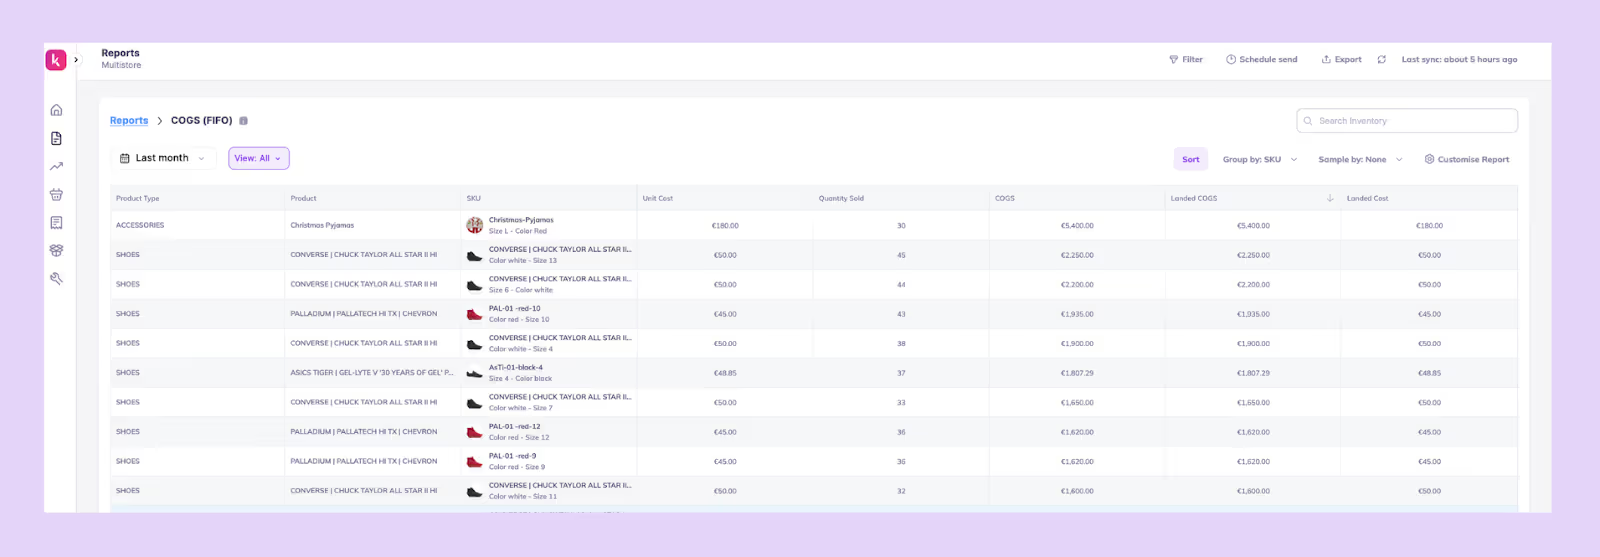
What it is: This one is a financial report that applies FIFO costing automatically to show true SKU-level profitability.
How it helps: Gives accurate COGS and margin visibility so you can refine pricing, plan promotions responsibly, and evaluate product-level performance.
What it includes: SKU, Unit cost, Quantity sold, COGS, Landed COGS, and Landed cost.
6. Multi-Location Sell Through Report

What it is: This is a comparison of how inventory performs across warehouses, stores, or fulfillment locations.
How it helps: Shows where stock is stuck or moving too fast, helping you transfer or restock, avoid localized stockouts, and optimize fulfillment decisions.
What it includes: Product, Location, Quantity sold, Total stock, and Sell-through rate.
7. ABC Report
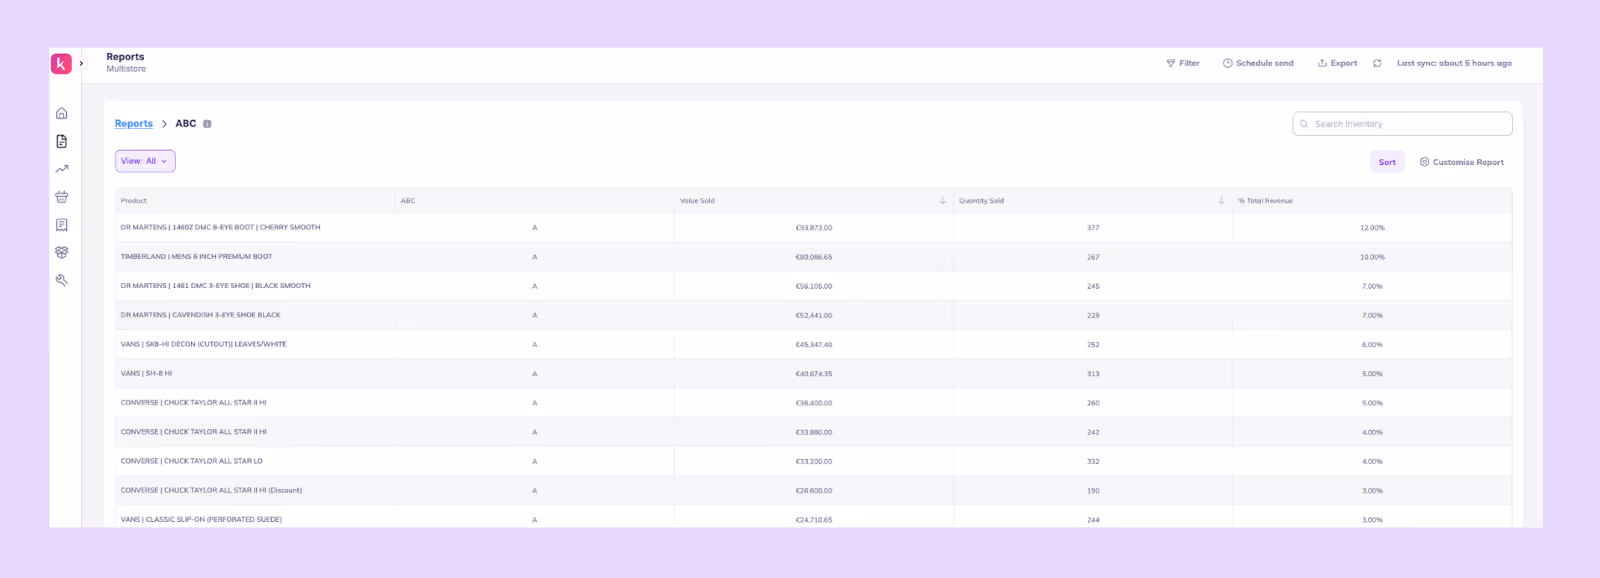
What it is: This report is a classification of SKUs into A, B, and C categories based on contribution to revenue, demand consistency, or profitability, automatically refreshed by AI as patterns change.
How it helps: Helps you focus forecasting, purchasing, and promotion efforts on the SKUs that matter most to your business.
What it includes: Product, ABC rankings, Value sold, Quantity sold, and % of Total revenue.
Best Practices to Get the Most From AI Inventory Reports
AI reports are only as good as the data and context you feed into them.
The more accurately your operations are modeled, the more precise your forecasts, alerts, and reports will be.
Here’s how to tighten your setup so that AI reporting becomes a source of smarter inventory decisions.
1. Set your lead times and safety stock correctly
Your AI reports depend on how accurate your operational inputs are, so start by verifying your lead times and safety stock.
Instead of using a blanket lead time for all products, calculate actual averages for the past 6-12 months per supplier or category. If Supplier A takes 28-32 days while Supplier B takes 18-40 days, your AI needs to know that difference to make realistic reorder suggestions.
Once lead times are correct, adjust your safety stock with a simple but reliable formula. For example, if your average lead time is 30 days but the longest stretch has been 45, your safety stock should cover for those 45 days, not the ideal 30.
When these values are accurate, your AI’s days of cover, reorder dates, and stockout predictions become far more trustworthy.
2. Keep the catalog clean
AI struggles when your catalog is messy. So treat catalog hygiene as part of your reporting process.
Simplify your products by removing dead SKUs that haven’t moved in months, fixing duplicate SKUs, and ensuring every product has clean variant relationships and consistent metafields like category, supplier, and collection.
Bundles often break reports and forecasting if not mapped correctly. AI will predict demand for the bundle but miss the fact that each sale consumes multiple underlying SKUs. A simple fix is maintaining an accurate bill of materials and linking bundle components properly.
A clean, structured catalog helps AI identify real patterns, catch demand shifts early, and avoid false signals from clutter or mis-mapped product data.
3. Track supplier reliability
AI insights get sharper when they’re grounded in real supplier performance rather than assumed dates.
Build a habit of noting the promised and actual delivery dates for every PO and tracking issues like partial shipments or quality failures.
Over time, this creates a reliability score for each supplier; some may consistently deliver within 5% variance while others fluctuate widely.
When your AI learns that Supplier C is often late, it automatically extends reorder buffers or suggests earlier POs, instead of giving you false confidence.
4. Create report schedules
AI reports only lead to action when they are delivered at the right time to the right people.
Instead of checking dashboards manually, schedule recurring reports: daily low-stock alerts for warehouse teams, weekly demand summaries for planners, and monthly aging or excess inventory reports for finance and ops.
A consistent reporting cadence ensures insights don’t just sit inside the tool; they trigger workflows and keep teams aligned around forecasting, replenishment, and inventory health.
5. Use scenario planning before major events (BFCM)
AI is most powerful when it helps you plan for the future, not just analyze the past. Before big events like BFCM, use scenario planning to test different sales uplifts: 2x, 3x, or 5x your baseline and see how your coverage, replenishment dates, and stockout timelines shift.
This helps you answer questions like “If my top SKUs sell 4x faster, when do I run out?”
For example, if a product normally sells 10 units/day but historically jumps to 40/day during BFCM, your AI will immediately flag that the current stock will only last a few days.
Running these scenarios early helps you adjust now, whether that’s increasing safety stock, placing POs sooner, or redistributing inventory, rather than firefighting mid-sale.
Examples of AI Inventory Tools & Applications
Below are some commonly used AI inventory tools and how they’re applied in practice.
1. Prediko
Built for Shopify-first brands, Prediko combines AI demand forecasting, replenishment planning, and PO management in one platform.
It helps teams automate buying decisions, track stock across locations, and act on real-time insights without relying on spreadsheets. It also offers AI agents that can execute tasks on autopilot, reducing manual work and speeding up day-to-day operations.
2. Manhattan Active
Manhattan Active focuses on execution at the warehouse and fulfillment level. It uses AI to optimize picking, packing, order routing, and inventory movement across distribution centers, making it suitable for large, complex supply chains.
3. Toolio
Toolio’s AI is built for merchandising teams to plan assortments and manage open-to-buy budgets. It connects inventory decisions with financial goals like revenue, margins, and sell-through, helping teams decide what products to invest in.
4. Cin7
Cin7 is a software that lets you manage inventory, orders, and sales channels. Its Foresight AI helps maintain stock accuracy across retail, wholesale, and online channels, and helps streamline operational workflows like order syncing and fulfillment.
5. Oracle Retail
Oracle Retail provides a full suite of planning tools, including demand forecasting, replenishment, and allocation, all powered by AI. It’s typically used by large retailers managing thousands of SKUs and multiple locations, where centralized planning is critical.
6. RELEX Solutions
RELEX uses machine learning to forecast demand and allocate inventory across stores and distribution centers. It helps retailers ensure the right products are available in the right locations, especially in high-volume, multi-store environments.
How Prediko Automates AI Inventory Reporting for Shopify Stores
Prediko takes the manual work out of reporting by turning your raw inventory data into clear, automated insights you can act on every day.
Instead of pulling spreadsheets, reconciling numbers, or guessing what will sell next, Prediko’s AI processes your sales, stock levels, lead times, and supplier data in the background and delivers the reports directly to your inbox or dashboard.
1. 20+ Ready-to-use AI inventory reports
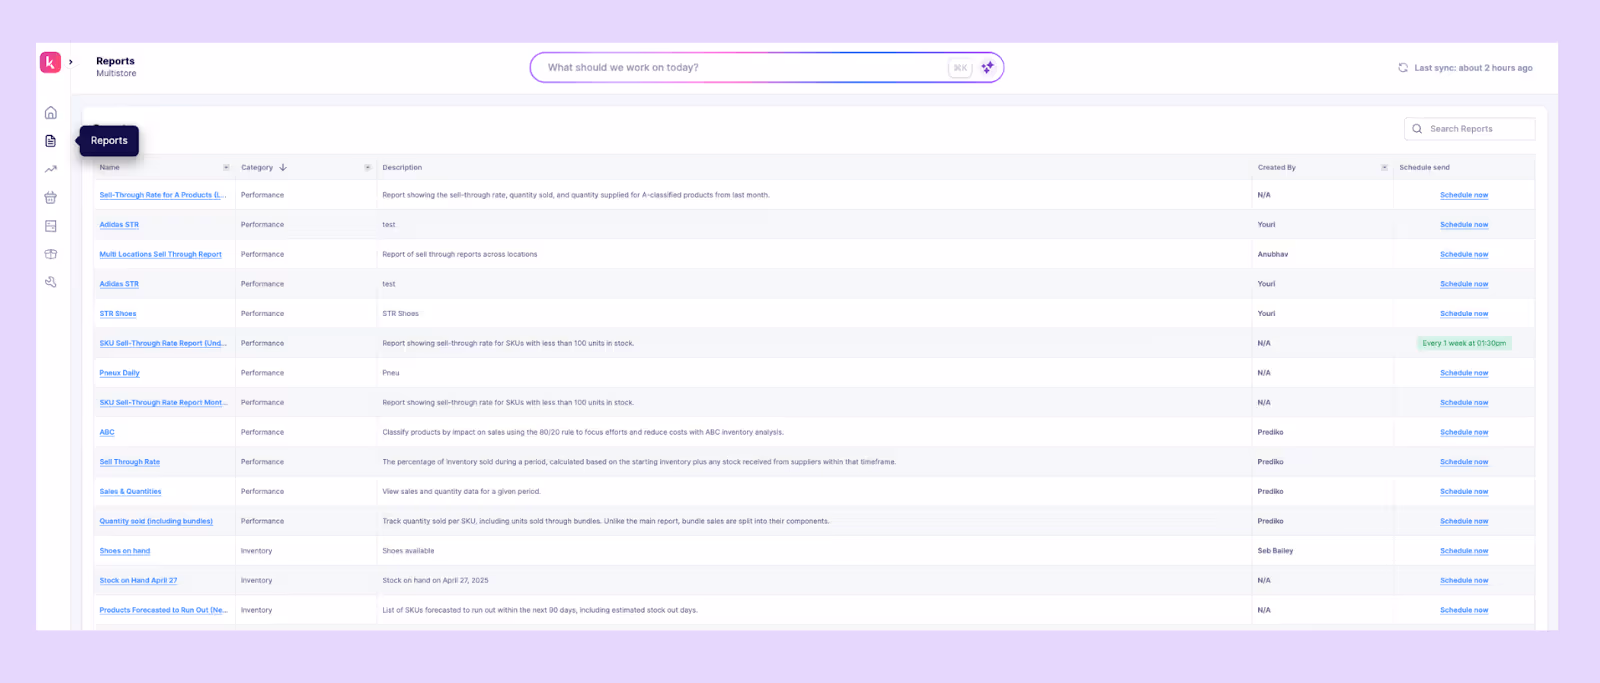
Prediko comes with more than 20 AI-powered inventory reports, from sell-through and stockout risk to overstock, ABC analysis, and multi-location insights. Each report is automatically updated and built to highlight the right operational signals at the right time.
2. Daily/weekly automated email reports
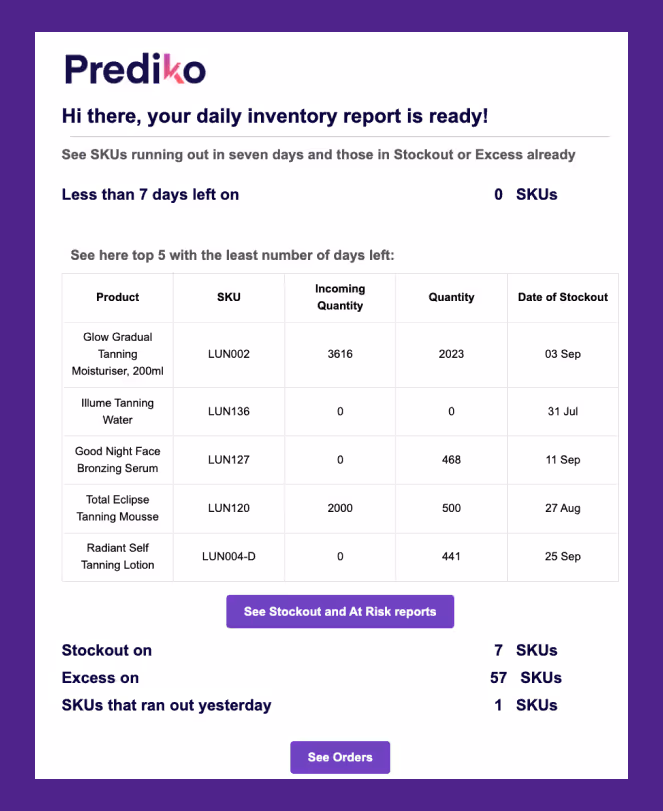
Prediko sends scheduled reports straight to your inbox so you don’t have to manually check dashboards. You get daily or weekly updates on stockouts, overstock, sales velocity, and upcoming stockout risks.
3. AI Forecasting engine trained on 25M SKUs
Prediko’s forecasting AI, trained on more than 25 million SKUs across 15 industries, detects demand shifts, seasonality patterns, and velocity changes earlier than spreadsheet models. It recalibrates constantly to deliver accurate reorder dates and quantities.
4. Store, SKU, variant, and warehouse-level insights
Prediko breaks down demand and stock behaviour at every layer –by store, warehouse, SKU, and variant –so you know exactly where products move well and where they stall.
5. Multi-location coverage
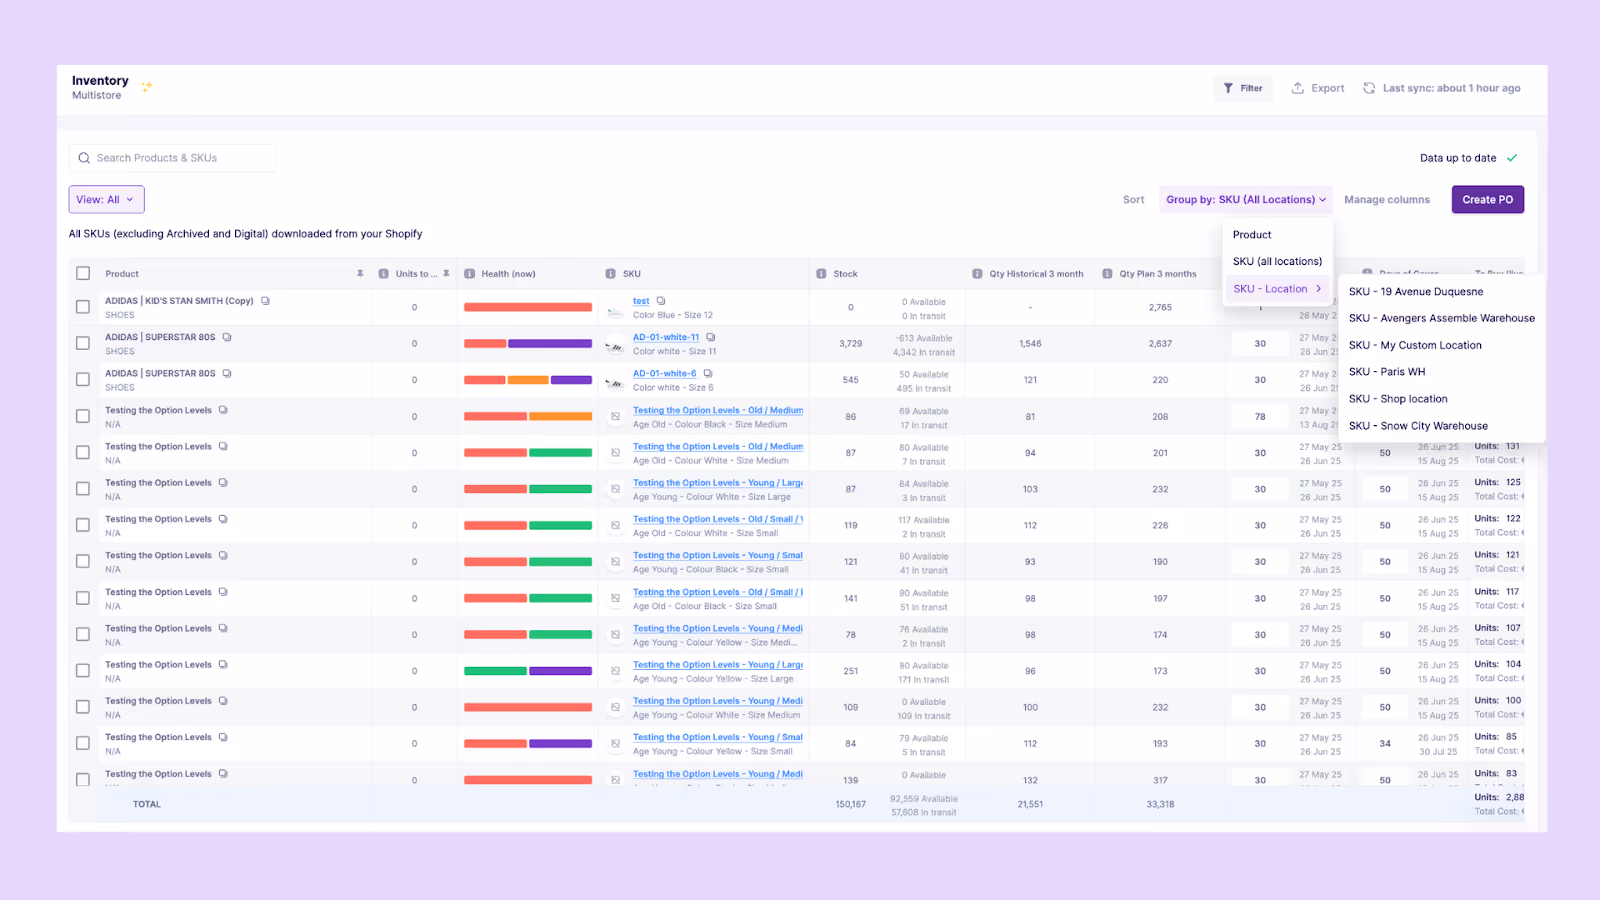
Prediko compares performance across warehouses, stores, and 3PLs to highlight imbalances. It shows where stock is running out, where it’s piling up, and where transfers can prevent stockouts or excess.
6. Supplier and PO tracking
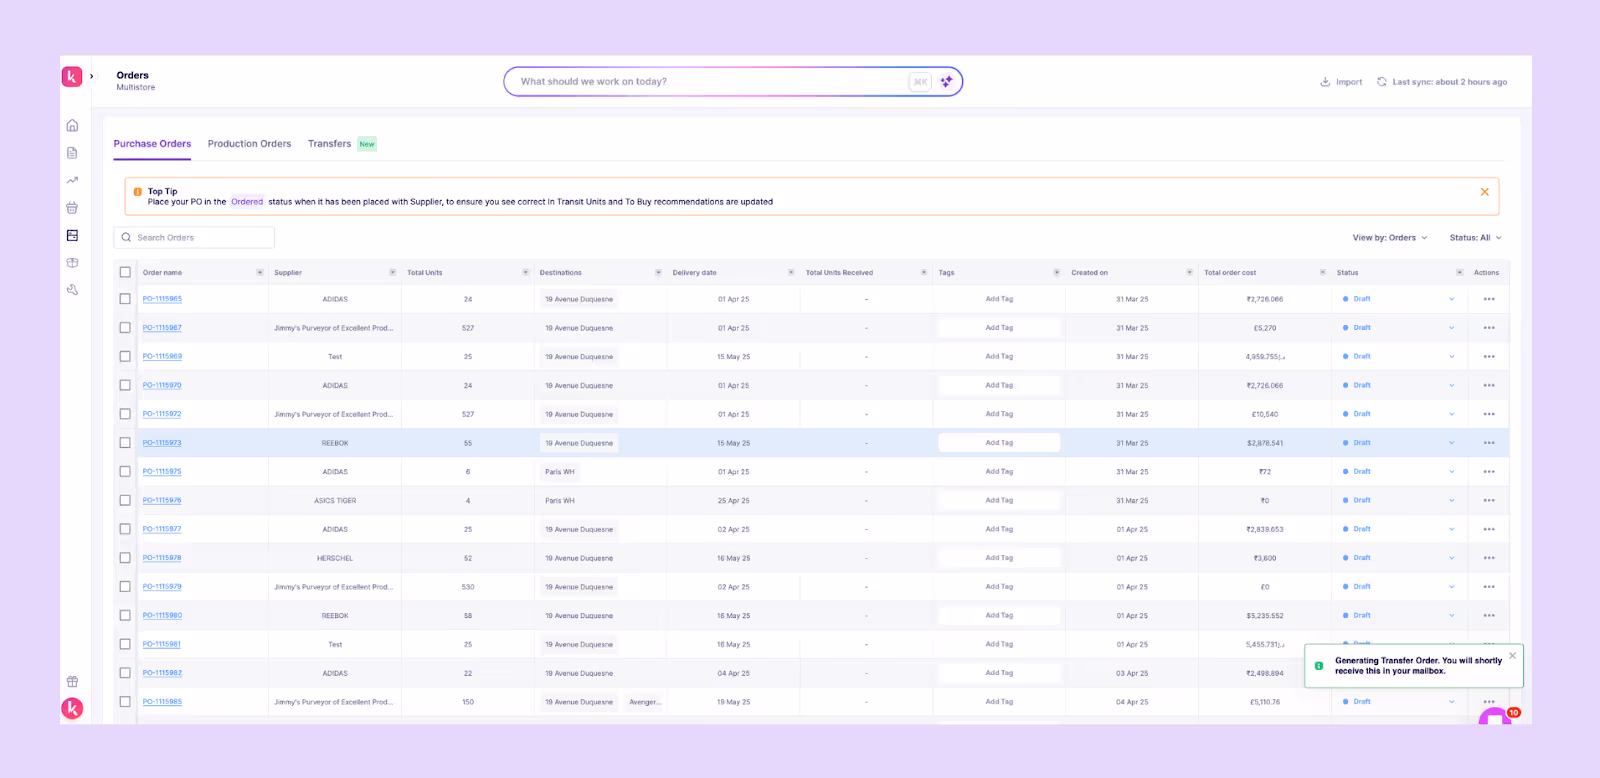
You can easily track incoming POs and shipments directly inside Prediko, and once items are marked as received, Prediko automatically updates your stock levels everywhere. No manual edits as forecasts and reports stay accurate in real time.
7. Integrations with Shopify, WMS, 3PLs
Prediko syncs with Shopify, warehouse systems, and 3PLs so every report reflects real-time stock movements, orders, receipts, and transfers without manual reconciliation.
If you’d like to see how these reports and features work in practice and how much time they can save your team each week, start a 14-day free trial of Prediko and explore everything using your own data.
Frequently Asked Questions (FAQs)