What Are Popular Demand Planning Models?
Demand planning models are the demand forecasting methods a demand planning methodology uses to estimate each SKU's demand, either statistical (exponential smoothing, ARIMA, intermittent-demand methods, machine learning) or judgmental (Delphi panels, analogy, scenarios).
The model that wins is the one that beats a naive forecast on your own SKUs
forecasting in Excel shows.
How Do You Forecast a Product With No Sales History?
A product with no sales history is forecast by
1. Take a comparable product's launch curve and scale it to the demand you expect.
2. A new variant of an existing product borrows its parent's history, split across variants and updated as variant sales arrive.
See forecasting demand for new products.
How Accurate Can a Demand Forecast Be?
Demand forecast accuracy has no universal target, because predictability depends on many factors, the data, how similar the future is to the past, and whether the forecast affects the outcome.
In an anonymised analysis of about 95,000 in-stock SKUs across 133+ Shopify brands (April to September 2026), median monthly forecast error (WAPE) was 29% for steady sellers, 48% for variable ones, 82% for new products and 94% for intermittent sellers. Accuracy targets should therefore be set per demand pattern, not as one number.
Weeks when a SKU was out of stock understate demand, so flag or adjust them, and any one-off orders, before judging accuracy.
Which Demand Planning KPIs Matter?
Demand planning KPIs are the error measures and stock outcomes that show whether forecasts are accurate and protect availability.
See forecast accuracy formula.
How Granular Should a Demand Forecast Be?
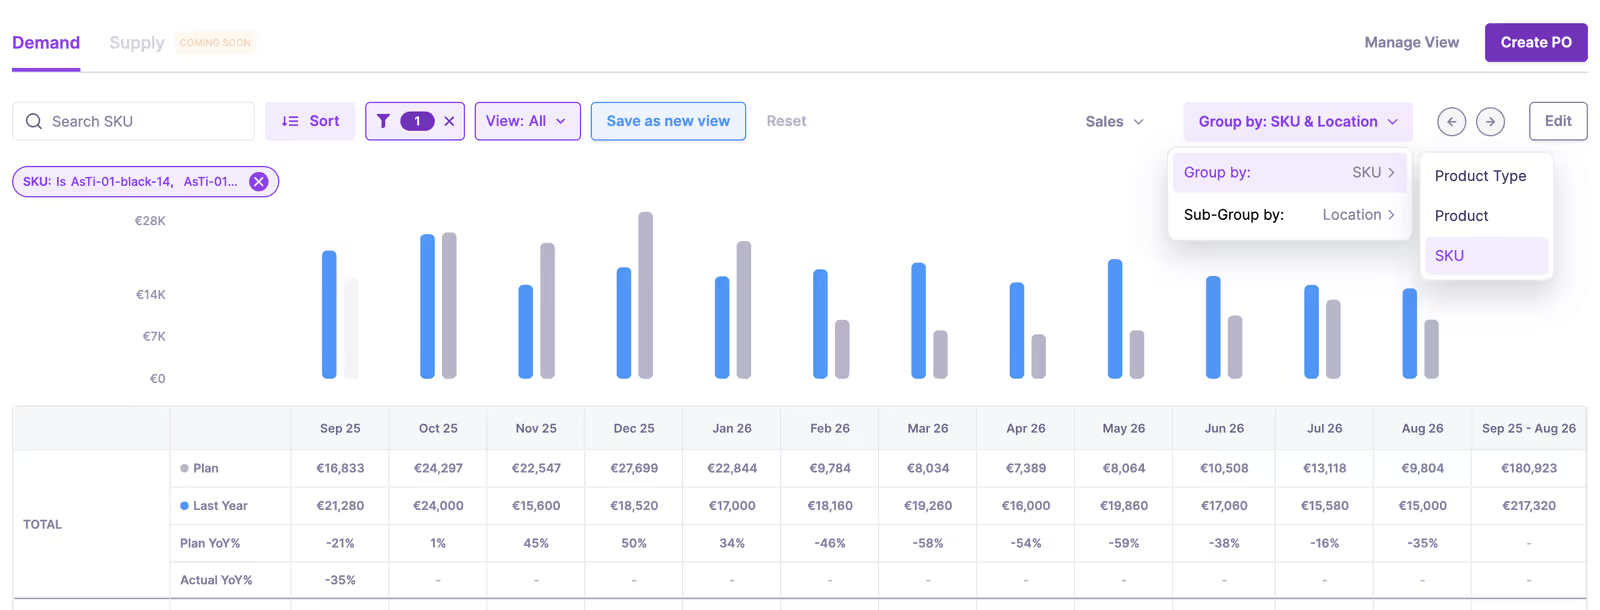
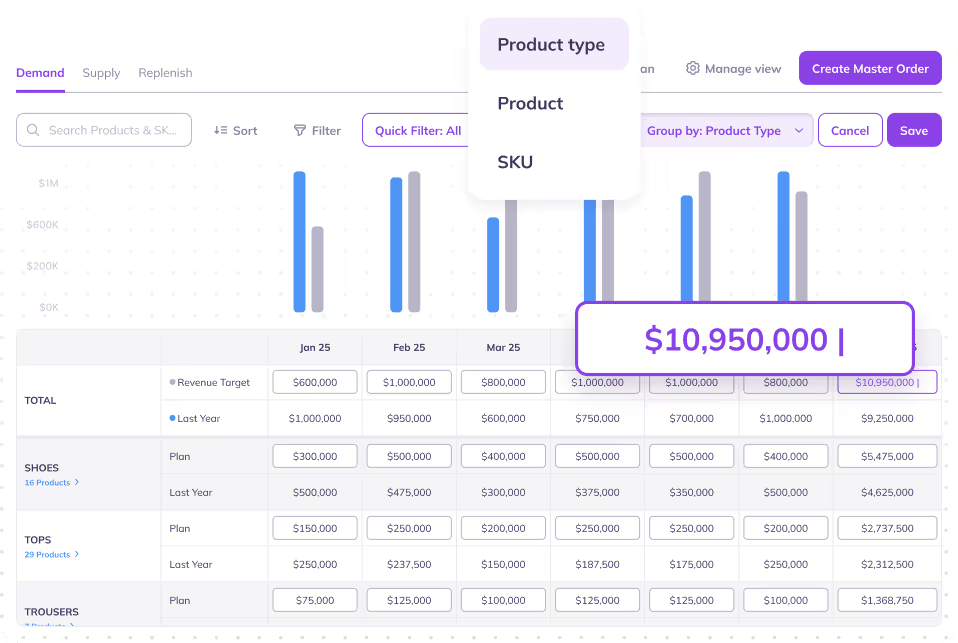
A forecast should be built at the level where the decision is made, whether SKU, product type or channel. Product-type, channel and SKU plans give different totals unless the levels reconcile.
Demand for the same SKU from online, marketplace and B2B channels is combined into one forecast before ordering.
Some SKUs have a higher sales velocity than other SKUs, so depending on the pace of selling, the demand forecast could either be weekly or monthly.
See SKU forecasting.
How Do You Plan for Seasons and Promotions?
Seasonal and promotional demand are forecast differently: seasons repeat from history, while promotions need planned inputs such as the promotion calendar, pricing and sales of complementary and substitute products, and their effects are proportional uplifts, not unit counts.
Promotions change the variance of demand as well as its mean, so they change safety stock needed.
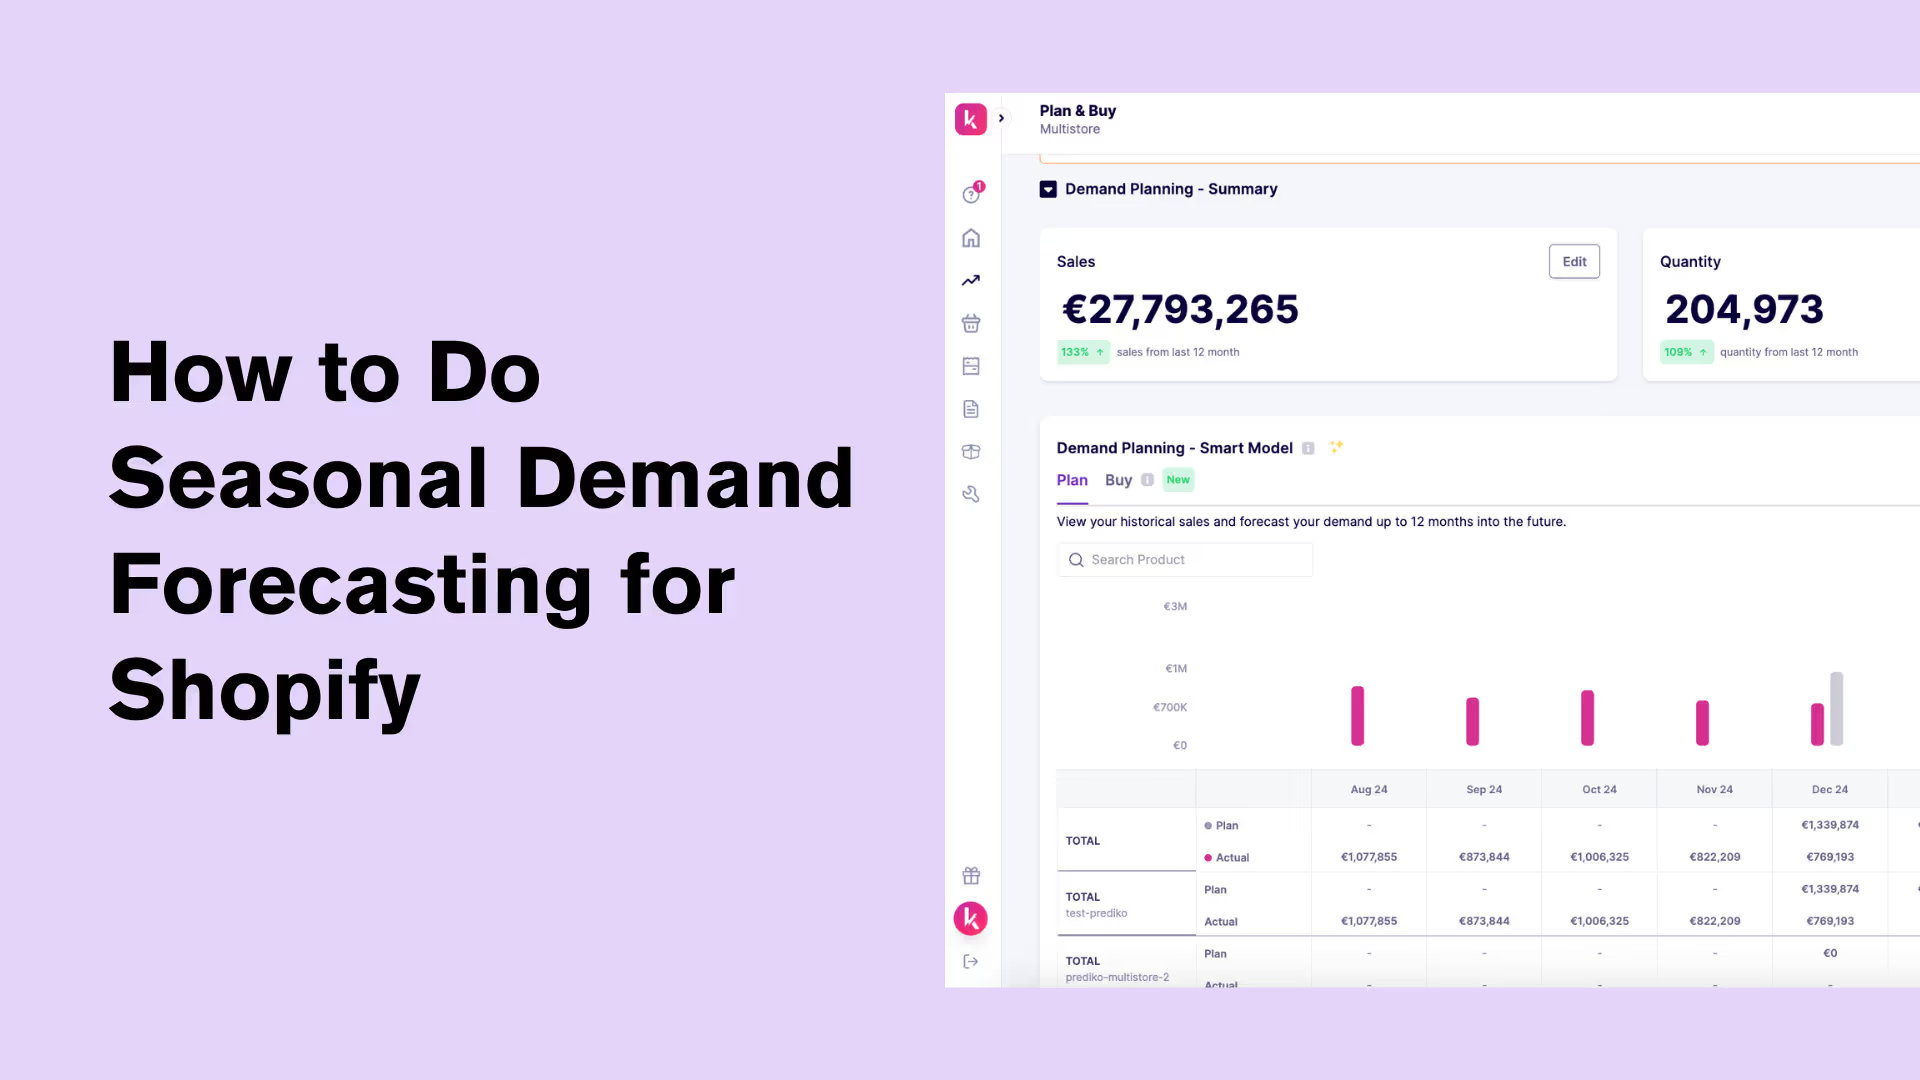
See seasonal demand forecasting.
How Do You Adjust a Forecast for Growth and One-Off Orders?
A forecast needs an explicit growth assumption, because history cannot show growth that has not happened yet. Carrying last year's level forward assumes none.
One off orders such as wholesale, influencer or promotional demand should be removed from the baseline history and added back as planned events, so they do not repeat in the baseline.
Variability that remains after these adjustments still needs safety stock. See demand variability.
How Do Forecasts Become Purchase Orders?
Forecasts become purchase orders when a per-period quantity is converted into an order quantity and date, after stock on hand, open purchase orders and lead time.
With a fixed order calendar, the forecast must cover the time to the next order plus the lead time.
Minimum order quantities and case packs round the order, lead times should be re-measured from actual receipts, and kits and bundles need component demand derived from parent forecasts.
Minimum order quantities and case packs round the order. Lead times should be re-measured from actual receipts: across 28,500 received purchase orders from 471 Shopify brands (January to September 2026), 36.5% were received later than the expected arrival date set on the PO, and the median late PO was 6 days behind. Kits and bundles need component demand derived from parent forecasts.
Can You Forecast Without a Data Science Team?
Forecasting without a data science team is possible when the history length fits the model and the process has strong organizational support.
A short history favors simpler models, and a few weeks of data cannot show a season.
See AI agents for demand forecasting.
How Do Teams Share One Demand Plan?
Teams share one demand plan by working from one set of numbers in sales and operations planning (S&OP), which brings together "different business plans ... into one integrated set of plans".
Team sometimes "adjust much more often than they should, and many times for the wrong reasons".
In one case, management adjustment cut accuracy from 65% to 62%
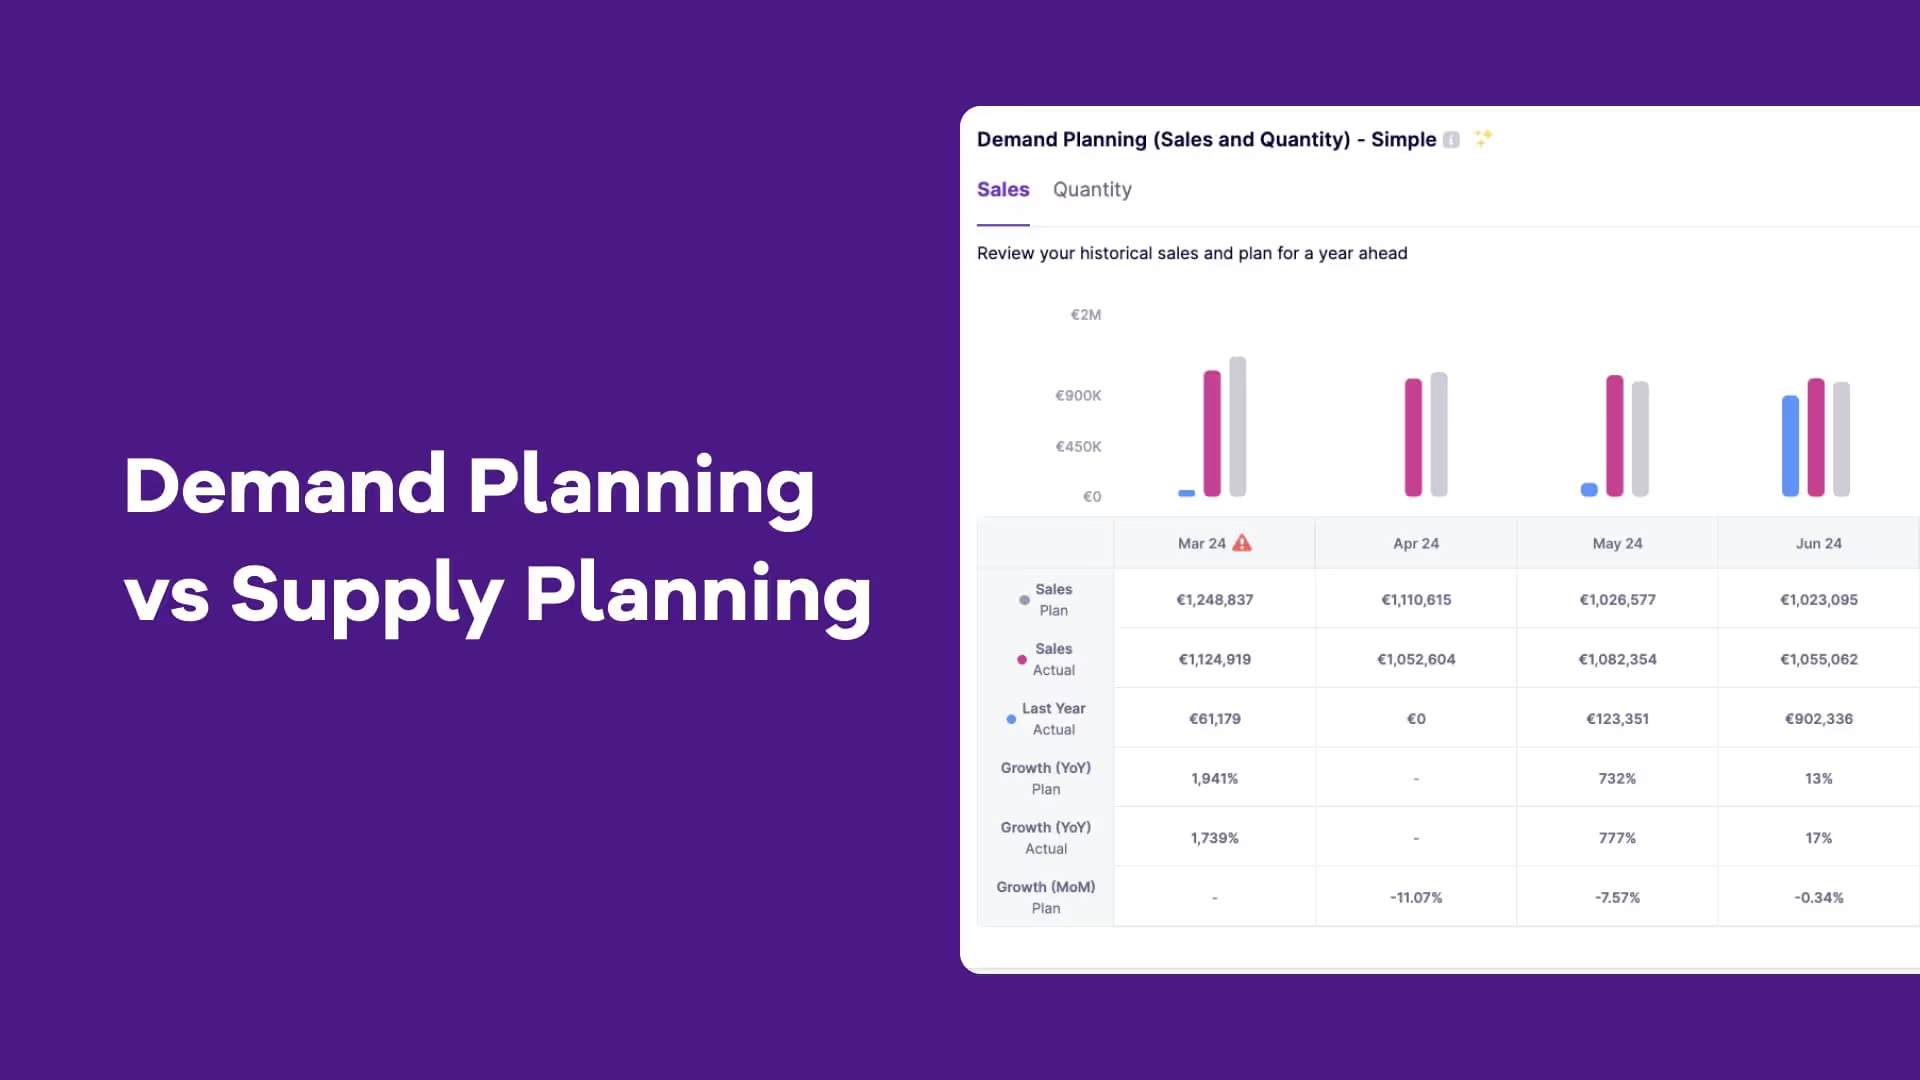
See demand planning vs supply planning.
Frequently Asked Questions on Demand Forecasting & Planning
How Does a Dedicated Demand Planner Help Versus Just Using Software to Forecast Inventory?
A dedicated demand planner adds judgment that software can't. Reading a competitor's stockout, weighing a supplier's reliability, or overriding a forecast because of something happening on the ground the data hasn't caught up to yet.
Software can handle the repetitive calculation at scale. A planner decides when to trust it and when to step in.
Can I integrate Demand Forecasting Into My Annual Operations Plan?
Yes, demand forecasting feeds directly into annual operations planning. Use it to set your baseline sales targets, then revisit the plan monthly or quarterly as new forecasts come in.
What Questions Should You Ask Vendors When Evaluating AI Reordering Features?
Ask how the model will handle a product with only one or two prior seasons of data, whether reorder triggers adjust automatically as the season progresses or requires a manual reset each cycle.
How Do You Automatically Detect Purchase Orders That Don't Match Your Forecast?
Plan vs actual tracking within a software is built for exactly this. It will compare what you ordered against what the forecast said you'd need and flags the gap directly, instead of you noticing months later that a PO was sized off the wrong number.
If you need to plan purchase orders across locations rather than forecast demand, compare inventory planning software.
How Do You Forecast Ongoing Demand After an Influencer Spike?
Treat the spike itself as a data point, not as noise to filter out from the data. Real-time data analysis catches the initial surge (the same mechanism that flags a product going viral on TikTok before it shows up as a stockout), and the days immediately after tell you whether demand is settling at a new, higher baseline or reverting to the old one, which is what should actually drive the next reorder quantity.