

This post breaks down which inventory forecasting models are possible in Excel, why Excel struggles when it comes to a large number of SKUs, and when it’s time to switch to a dedicated software.
3 Inventory Forecasting Excel Models + Downloadable Templates
An inventory forecasting Excel template is a spreadsheet that helps estimate future stock needs using historical sales data, demand trends, and safety stock calculations.
Excel offers a range of methods to help you predict future demand with confidence. There are three commonly used methods of demand forecasting in Excel, each with its own strengths depending on the data and level of complexity you're working with. We have also included the templates that you can download for your brand or business.
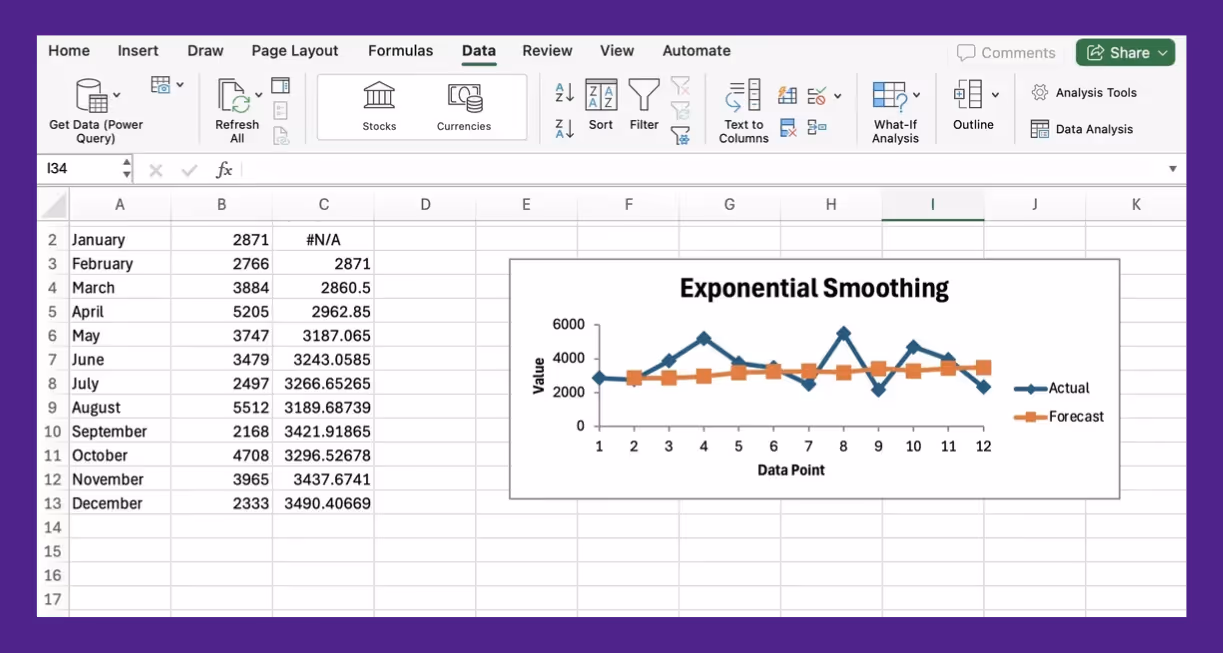
Method 1: Exponential Smoothing in Excel
If your sales jump in December and slow down in February, this method isfor you. Exponential smoothing is built to catch patterns like that, without getting thrown off by every random dip or spike in the data.
At the heart of this method is Excel’s FORECAST.ETS function. It uses an algorithm called AAA (additive error, additive trend, additive seasonality), which basically means it’s good at handling seasonality and spotting trends, all while smoothing out the weird outliers.
To get started, you just need a clean time series of historical sales data, monthly, weekly, or whatever works, as long as the intervals are consistent. Plug it into FORECAST.ETS, choose your target date, and Excel handles the rest.
There’s room to tweak things like seasonality and how missing data gets filled in, but the default settings usually do a decent job.
Why This Template Works
- It doesn’t overreact to every sudden change
- Picks up on repeating patterns, like holidays or end-of-quarter rushes
- Keeps recent data front and center, which helps when things shift quickly
- Already built into Excel, no add-ons needed
Where This Template Doesn't Work
- Your data has to be evenly spaced, missing weeks or skipped months throw it off
- Manual adjustments can get tedious if your data changes often
- Teams without much experience in forecasting might find the setup intimidating
- If there’s no real trend or seasonality, the results can be off
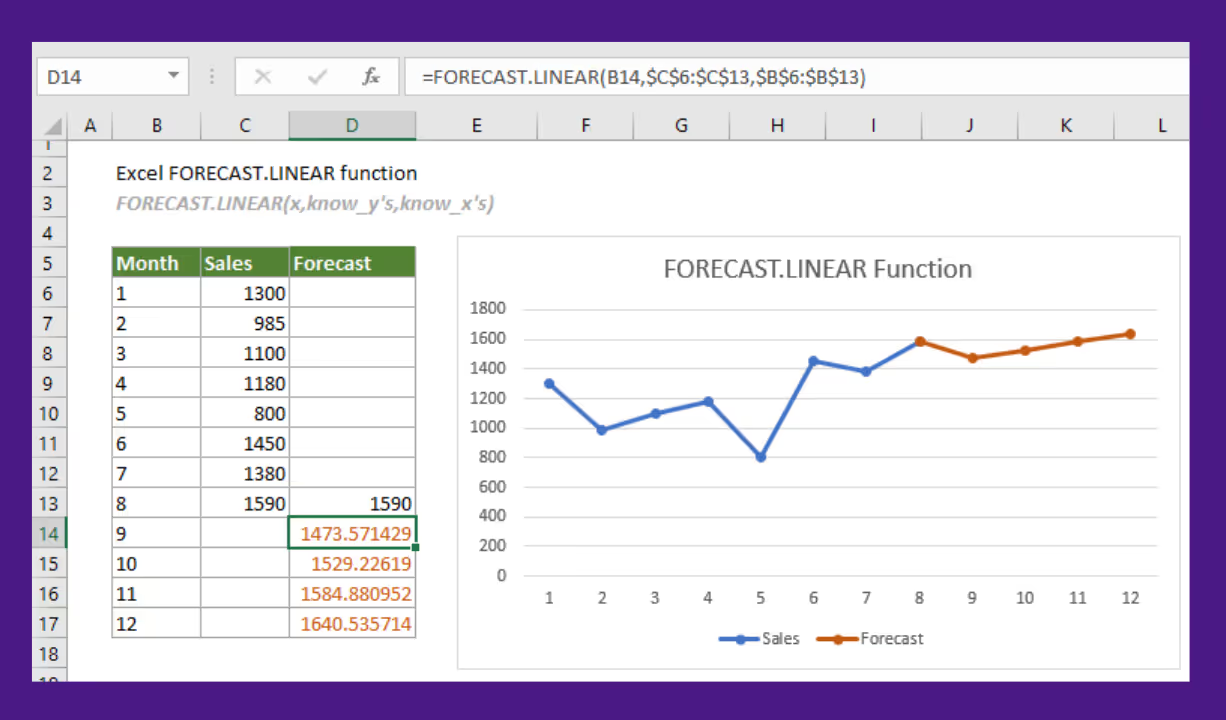
Method 2: Linear Regression for Demand Forecasting in Excel
Linear regression helps you forecast future demand based on a related factor you can control, like ad spend, discount percentage, or number of impressions.
It works by mapping the relationship between the variable and the sales output, so you can estimate demand at different input (variable) levels.
In Excel, this method works through the FORECAST.LINEAR function or by using the Analysis ToolPak add-in. Either way, the idea is the same: you’re drawing a straight line through your data to predict future outcomes based on past behavior.
For example, if you know sales tend to rise as ad spend increases, you can model that relationship and forecast demand at different spending levels. It’s simple math, but surprisingly effective when the connection between variables is strong.
Why This Template Works
- Makes it easy to visualize how one factor impacts another
- Works well when demand is clearly tied to external inputs such as price changes or weather
- Fast to set up with small datasets, just two columns and you're rolling
- Results are transparent, you can actually see the trend line and explain it
Where This Template Doesn't Work
- Not built for more than one input, multi-variable forecasting needs a more advanced setup
- Assumes the relationship stays consistent over time, which isn’t always true
- Doesn’t handle seasonality or randomness well
- Outliers can throw off the slope and lead to skewed predictions
Linear regression works best when you’re trying to quantify the impact of one specific variable.
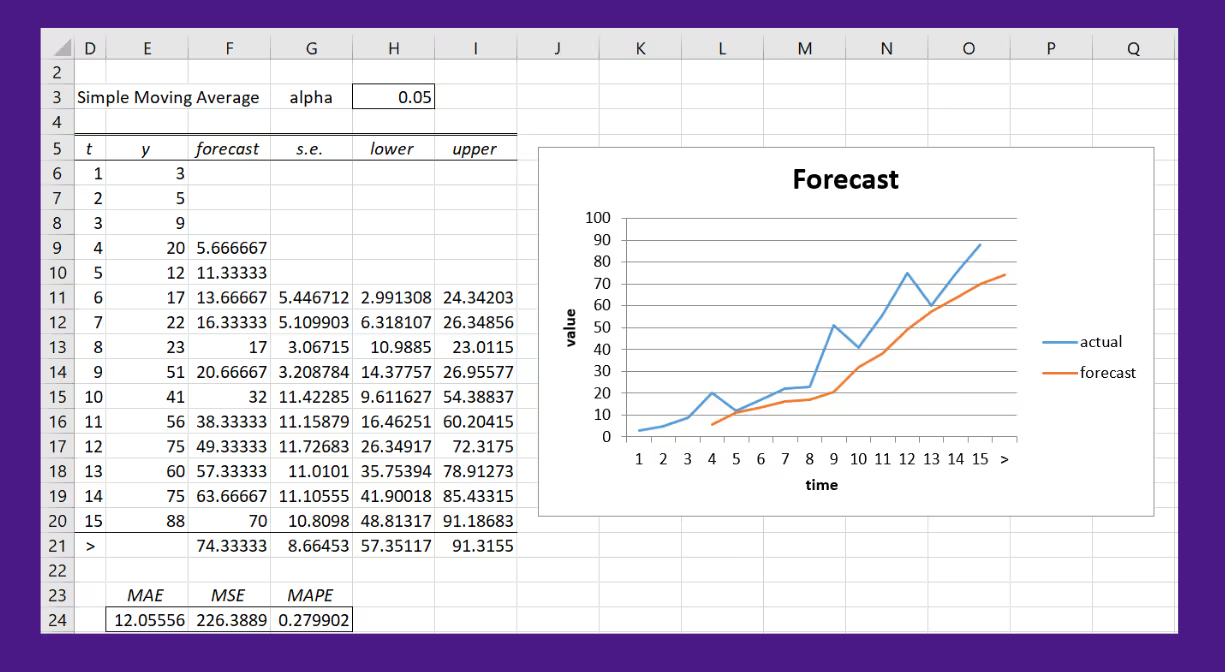
Method 3: Moving Averages in Excel
Sometimes the best method to forecast is to smooth data out. That’s exactly what moving averages do.
Instead of reacting to every twist and turn in your sales numbers, this method looks at a set period, say, the last 3 or 6 months, and averages it out. The goal is to spot short-term trends without getting distracted by every bump in the road.
In Excel, it’s as simple as using the AVERAGE function. Select a range of historical sales data, get the average, and then drag the formula down your column to keep the window moving.
This gives you a rolling average of sales over a set period. For a more automated approach, the Analysis ToolPak has a built-in Moving Average tool that handles the rolling logic for you.
Why This Template Works
- Straightforward to build, no fancy formulas needed
- Helps smooth out random noise in sales or stock data
- Useful for spotting short-term shifts when recent data matters most
- Easy to explain and visualize in reports or charts
Where This Template Doesn't Work
- Doesn't handle sudden spikes or drops, just flattens them out
- Assumes the future will look like the recent past, which isn't always true
- Can't pick up on seasonality or long-term trends
- Accuracy drops fast when used beyond a short forecast window
Why Forecasting in Excel Fails for Growing Brands
Despite all these methods and templates, the forecasting in Excel is not scalable. See how forecasting in excel compares to more advanced forecasting tools or software like Prediko.
1. Manual processes turn forecasting in Excel into a repetitive and long-duration process
Excel relies on manual updates. That means downloading sales reports, pasting new data into your inventory forecasting Excel template, updating formulas, and scanning for broken references. Each of those steps takes time, and they have to be done every single cycle.
The result is a forecast that’s always a few steps behind. If demand shifts mid-week, the spreadsheet doesn’t know. You’re working with static data in a dynamic environment.

These manual inputs add up. What looks like a quick task becomes a recurring one that quietly drains hours every week. That’s the time your team could spend making decisions, but instead, it’s spent maintaining spreadsheets.
2. Small data entry errors in Excel can lead to big inventory mistakes
Excel doesn’t warn you when an inventory data point looks off. Typing 120 units instead of 210 won’t trigger a single alert. Forecasts continue, stock levels get calculated, and a critical reorder might be missed.
This gets even riskier when multiple people are involved or data is coming in from different sources. Without any built-in checks, small errors can sneak in easily and go unnoticed until they cause damage.
By the time anyone catches it, the result is either stockouts, overstock, or an unfixable mess.
3. Excel can’t react when real-world events shift demand overnight
Let’s say your product gets picked up by a creator with a big audience. Sales spike within hours. But your forecast, built in Excel, doesn’t move. It’s still using last week’s numbers. Unless someone manually adjusts the spreadsheet, nothing changes.
Spreadsheets don’t respond to demand shifts in real-time. They’re built on historical data, not live inputs. If a supplier misses a delivery or a campaign drives unexpected traffic, your model stays frozen.
That lag creates risk. You miss reorder windows, run out of high-demand stock, or over-order products that were never part of the surge. The window to react closes fast, and by the time the forecast catches up, you’re already behind.
4. As your product catalog grows, Excel starts breaking down
Forecasting for a small product lineup feels simple. With ten SKUs, one spreadsheet can handle everything. But as your catalog grows, Excel starts showing its limits.
As performance dips, teams start creating copies just to keep moving. That’s when version control problems begin. One person updates the forecast, someone else is working on an older file, and nobody’s sure which one is current.
5. Excel lacks the forecasting logic needed for complex inventory planning
Basic trends and averages are built in. But if you want to forecast seasonality, lead times, sales campaigns, or safety stock, Excel can’t do that on its own.
You need to build custom logic with formulas or add-ons. That adds more complexity and requires ongoing maintenance. Every change to your catalog or sales pattern means another round of edits and checks.
Over time, the spreadsheet turns into a system you have to manage, not a tool that helps you move faster.
A Better Alternative to Inventory Forecasting Excel Models
Now that you understand inventory forecasting in Excel isn't scalable and can lead to errors that hurt your bottom line. So, what’s the solution here? It's switching to a software that makes inventory forecasting easy and quick.
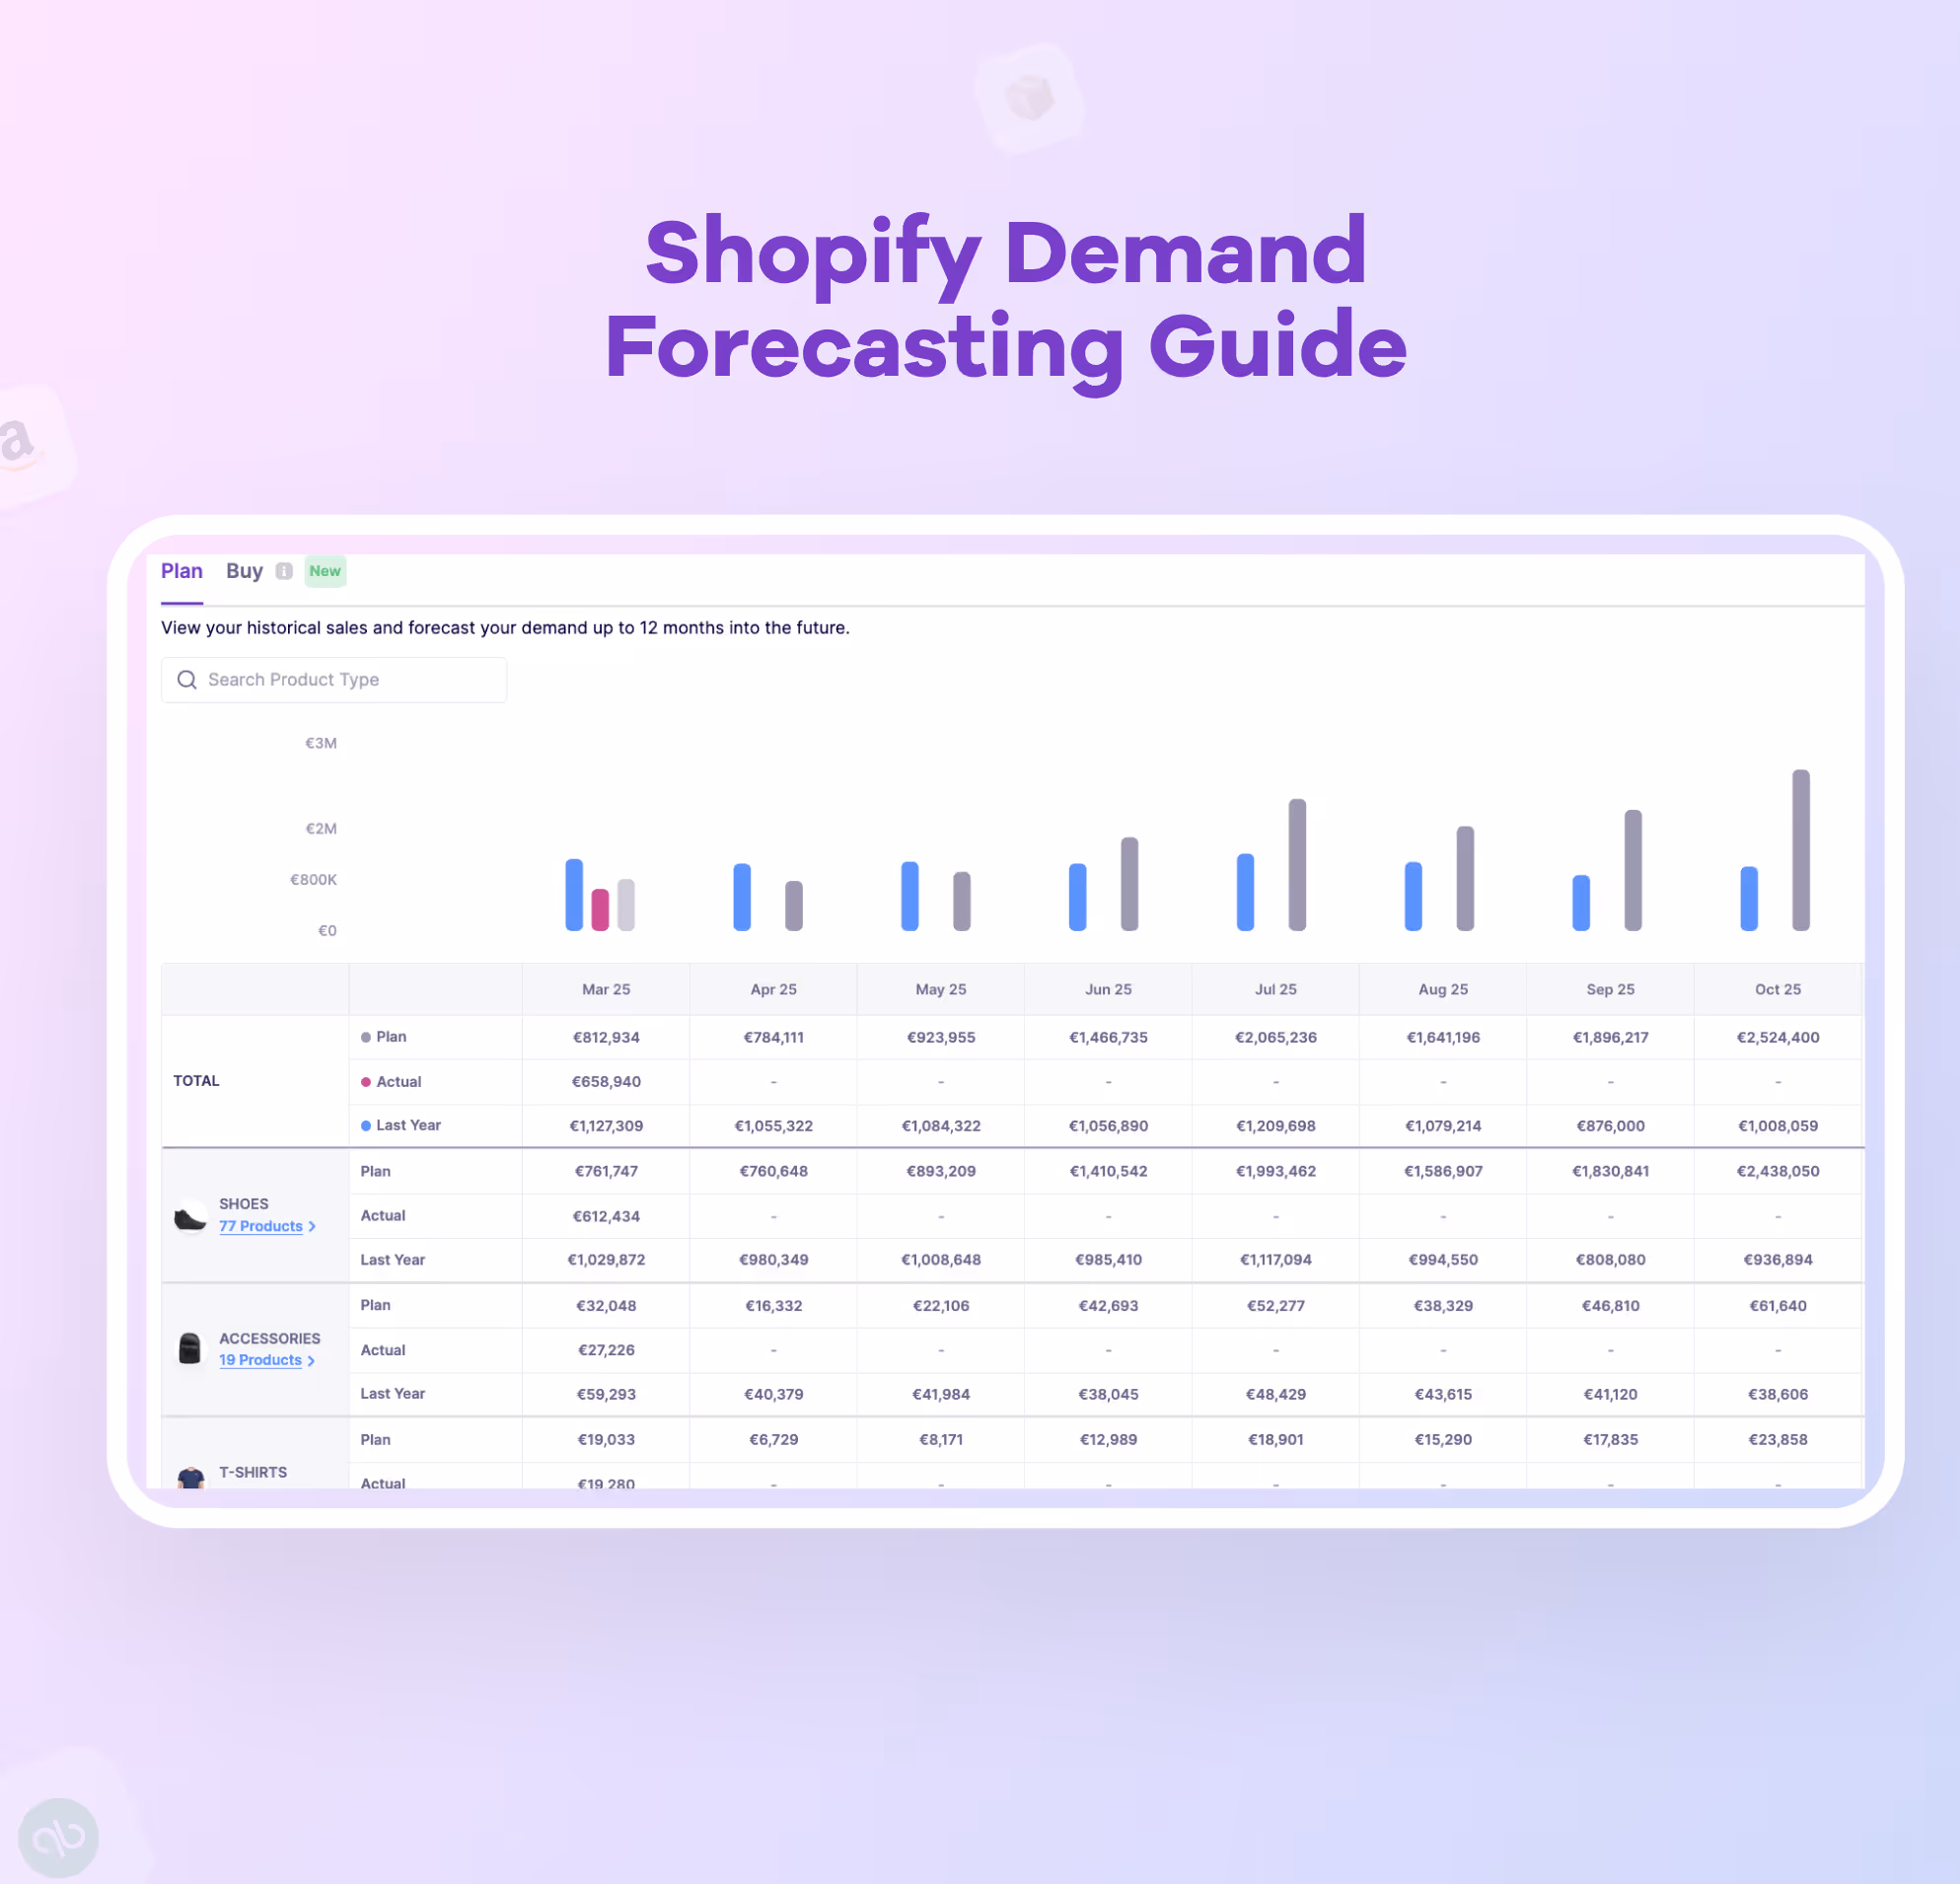
Prediko is built specifically for this. It’s an AI-powered inventory planning and management platform made for Shopify brands that need accurate forecasts without spending hours in spreadsheets.
It uses AI trained on 25 million SKUs to analyze historical sales, seasonality, and demand trends across your entire product catalog. Based on that, it sends real-time replenishment alerts so you know exactly what to order, when, and how much.
You’re no longer forecasting in isolation. Prediko pulls data across all your storefronts, warehouses, and 3PLs, giving you a complete view of your stock and future demand in one place.
Its key features include
- AI Demand & Supply Planning: Prediko’s AI pulls your sales history, seasonality, and growth trends across stores to generate forecasts.

- Reports & Analytics: Get a clear view of how accurate your forecasts are, what products are underperforming, and which SKUs are driving growth in real-time. This is not possible in Excel or spreadsheets.
Sync Protein Saved 10 hours/week by Switching from Excel to Prediko
The team at Sync Protein used to forecast demand manually in Excel using one of the templates. Every week involved exporting sales data, adjusting formulas, and working through purchase orders one by one.

As their product range grew, so did the time spent managing inventory. The process became harder to maintain and left too much room for errors.
After moving to Prediko, they’ve been able to cut down that manual work and get a clearer view of what needs restocking. Forecasting, reordering, and stock tracking now happens in one place.
Read the full case study here.
Frequently Asked Questions
1. How to forecast inventory in Excel for beginners?
Start with a simple moving average formula or use the FORECAST.ETS function on past sales data.
2. What’s the most accurate Excel forecasting method?
Exponential smoothing with FORECAST.ETS works well, but using a tool like Prediko gives better accuracy and real-time insights.
3. When to stop using Excel for inventory?
Once forecasting becomes time-consuming, error-prone, or hard to scale across SKUs, it’s time to switch to forecasting software like Prediko.