


You might think your reds, whites, and blacks all sell at the same pace, so you set the same reorder thresholds for each.
But in reality, blacks peak in winter, reds in February, and whites in fall. Every SKU behaves differently in the market, and that’s exactly why you need SKU-level forecasting.
What is SKU Forecasting and Why Is It Important
SKU forecasting focuses on projecting future demand for each individual SKU. It shows you how many units of a specific color, size, or variation of a product will be needed in a given period.
Aggregate demand forecasting, on the other hand, looks at total demand across categories, brands, or even an entire store.
While useful for high-level planning, it lacks the detail needed to manage inventory at the product level.
The difference is simple: aggregate forecasting shows the big picture, SKU forecasting gives the granularity needed to avoid inventory mistakes.
SKU forecasting is critical because it balances customer demand with financial efficiency, keeping the right products available without wasting money on excess stock. It also factors in seasonality, promotional spikes, and regional demand differences.
Key Benefits of SKU Forecasting
SKU-level forecasting affects everything from cash flow to customer experience. Here are the biggest benefits it brings.
1. Inventory optimization and reduced holding costs
Certain SKUs are best-sellers, and you need precise forecasts to keep them in stock. Others might move slowly, and overstocking them locks up cash.
2. Avoiding stockouts of best sellers
Customer loyalty is fragile. In fact, Gap estimated a US$300 million loss in one quarter due to inventory stockouts.
If a shopper visits your store twice and can’t find their preferred size or variation, chances are they’ll switch to a competitor who does.
Pinpoint which SKUs are bestsellers and ensuring they’re replenished before running out.
3. Better decision-making for pricing, promotions and product strategy
Not all SKUs behave the same. Some sell steadily, others peak seasonally, and a few decline even when the overall category looks strong.
SKU forecasting exposes these product-level trends so you can act with precision.
- Pricing: Easily identify and discount slow-moving SKUs before they clog up storage, without worrying about running out of high-demand ones
- Promotions: Know which SKUs will respond best to marketing pushes and which will cannibalize sales from other items
- Product strategy: Phase out underperformers, double down on consistent winners, and launch seasonal products more accurately
This level of visibility turns promotions and pricing from guesswork into strategy. You stop reacting after the fact and start planning with confidence.
Best Practices for SKU Forecasting Accuracy
1. Segment your SKUs
Segmenting SKUs means grouping products by characteristics such as demand patterns, sales volume, margin contribution, or lifecycle stage. Each segment can then be forecasted with the method that fits it best.
Here’s how to approach it
- High-volume, steady-demand SKUs: Need consistent replenishment
- Seasonal or trend-driven SKUs: Show spikes in certain months and need flexible forecasting
- Long-tail SKUs with unpredictable demand: Benefit more from safety stock buffers than aggressive forecasts
2. Factor in seasonality and external triggers
In 2024, American Eagle Outfitters lowered its annual sales growth forecast after warmer-than-expected weather slowed sales of jackets and other cold-weather apparel.
Seasonal products didn’t move as planned, leaving the company with excess stock and weaker holiday revenue.
This highlights why SKU forecasting can’t rely on past sales alone. Seasonality matters; coats in winter, sunscreen in summer, but external triggers often dictate the real outcome.
Weather, festivals, school calendars, or major sporting events can all shift demand suddenly. The solution is to layer seasonality and external signals on top of historical data for more accurate forecasts.
3. Use AI-powered forecasting apps
Manual forecasting quickly breaks down when you’re managing hundreds or thousands of SKUs. Spreadsheets can’t account for all the variables that drive demand, nor can they adapt fast when conditions shift.
AI-powered demand planning software help to automate the entire workflow of SKU forecasting.
Instead of relying on manual guesswork, you get accurate, automated purchase alerts to keep stock balanced and cash flow healthy.
4. Set safety stock and reorder points per SKU
Safety stock provides a buffer when demand spikes or suppliers are delayed, while reorder points signal the exact moment to replenish before stock runs out.
To be effective, both must be calculated at the SKU level to reflect real demand patterns.
Economic Order Quantity (EOQ) adds another layer by identifying the most cost-efficient order size, balancing holding costs with ordering costs.
Together, these calculations reduce the risk of overstocking while avoiding last-minute emergency reorders.
For example, a fast-selling T-shirt line might need higher safety stock and tighter reorder points than a niche accessory that sells slowly. Treating them the same risks tying up capital in the wrong SKUs or missing sales altogether.
5. Leverage SKU relationships
SKUs often influence each other’s sales. Some are substitutes; if one runs out, customers switch to a similar product. Others are complements; they sell together, like shoes and laces.
Forecasting them in isolation means you may overstock one item and understock another.
For example, if a retailer runs out of a best-selling sneaker, demand might spill over to a similar model. Without accounting for that link, the substitute could stock out too, leaving missed sales across both products.
Recognizing these relationships makes forecasts more realistic and ensures inventory is balanced across connected SKUs.
SKU Forecasting Methods and Models
There’s no single way to forecast demand at the SKU level. The right method depends on the type of products you sell, how predictable demand is, and the data you have available.
We have gone in depth about the type, pros and cons of different inventory forecasting techniques
How to Implement a SKU Demand Forecasting Workflow
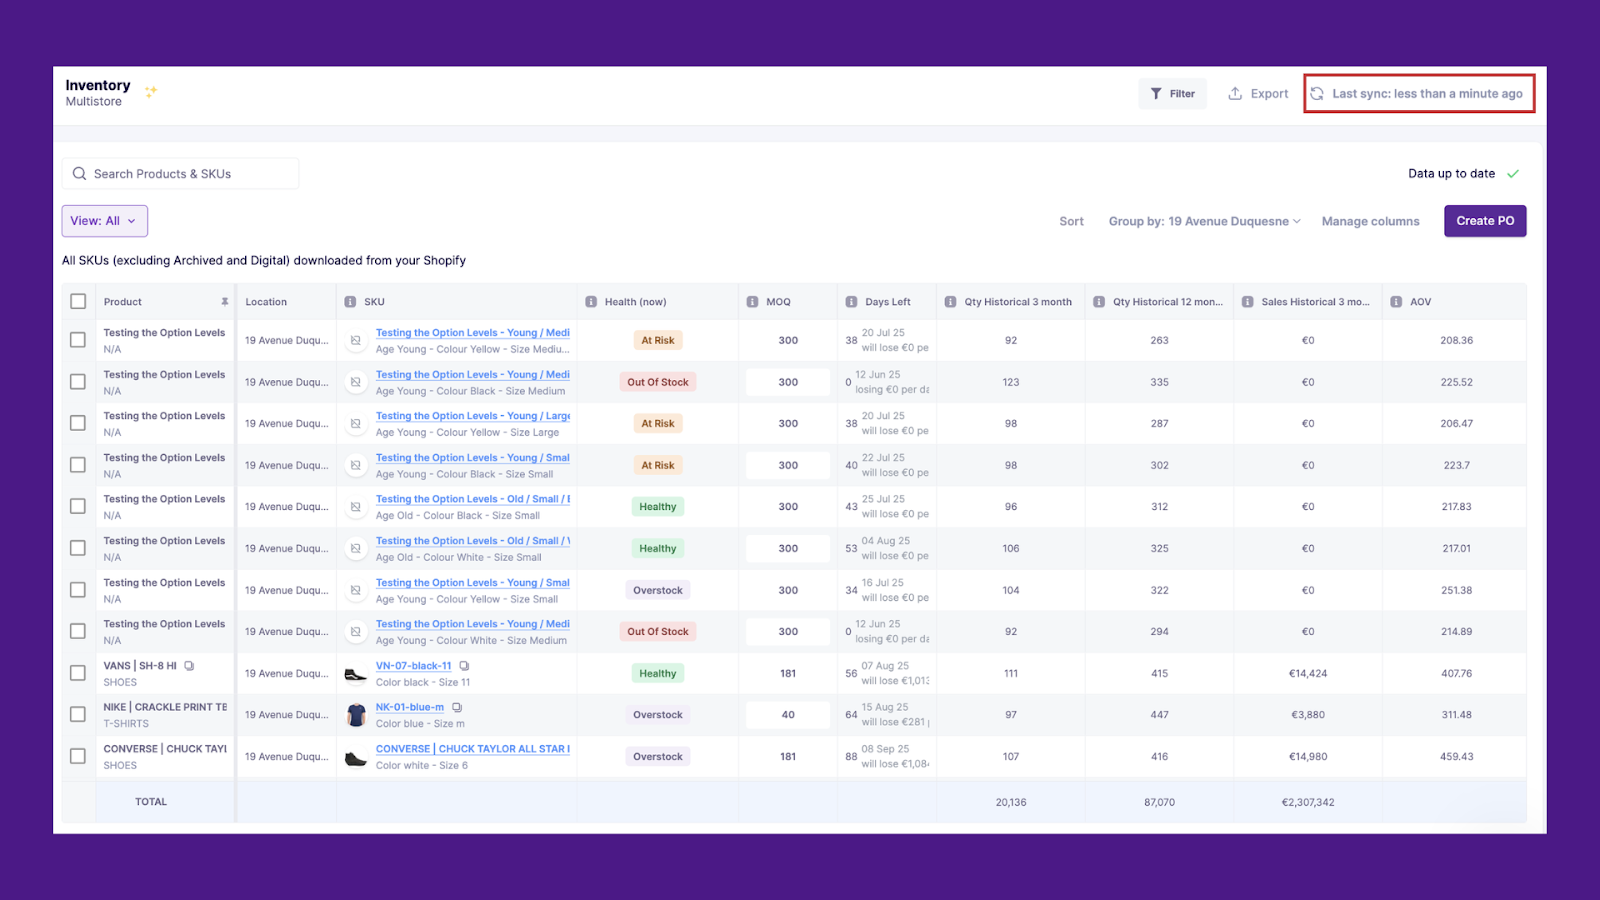
Step 1: Data collection and cleaning
Data should be captured at the most granular level, down to each SKU, location, and time period.
Duplicate entries, missing values, or outdated records can distort the actual demand patterns, so cleaning the dataset is critical to ensure only reliable information feeds the forecast.
Aim for real-time data as it further improves accuracy. Instead of relying on sales numbers that are weeks old, you can respond quickly when demand shifts.
Step 2: SKU Categorization
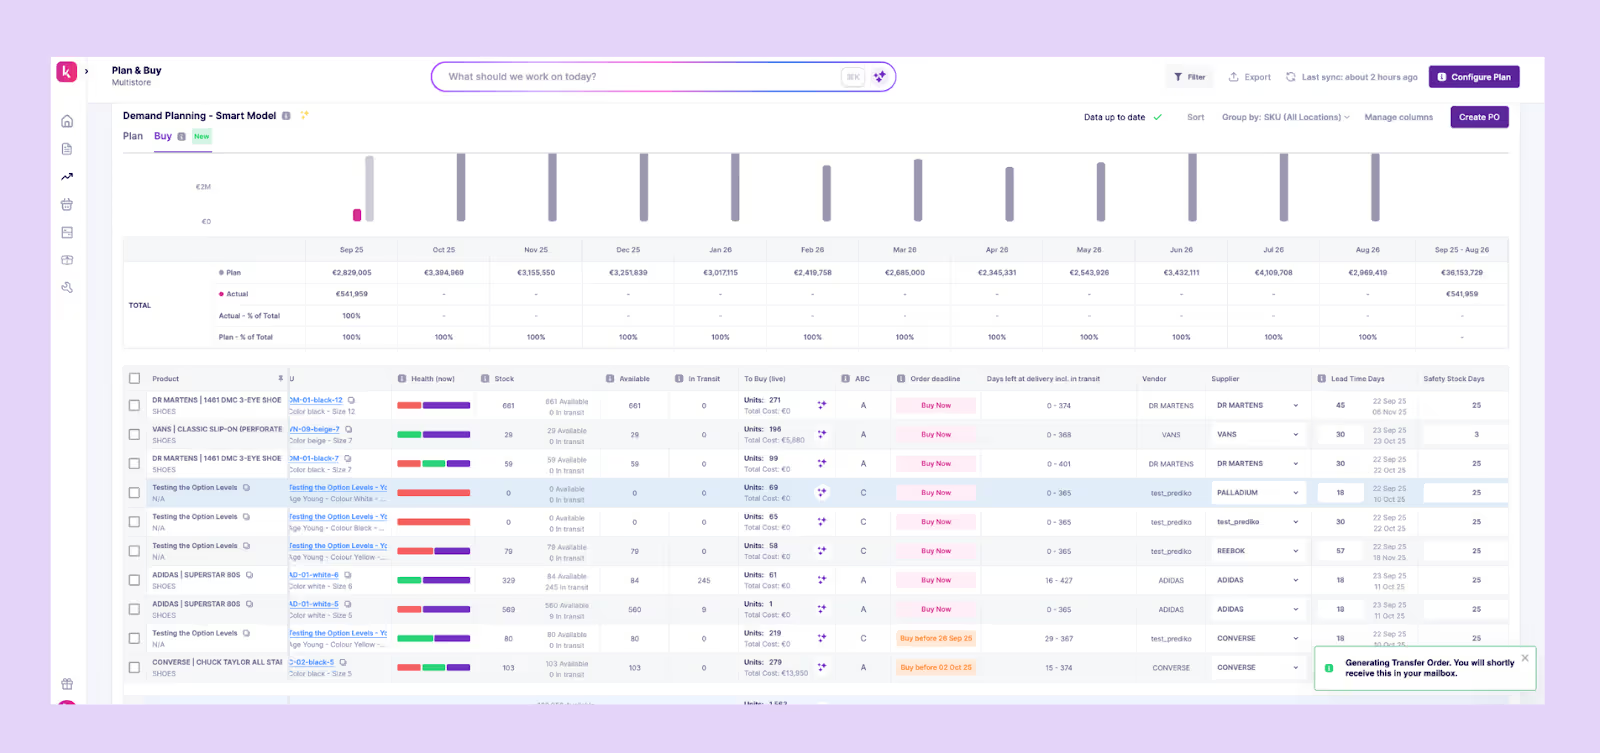
Once data is collected and cleaned, the next step is to categorize SKUs. Two common methods are:
- ABC analysis: Classifies SKUs based on their contribution to revenue.
- A items are high-value products that make up a small share of SKUs but a large share of sales
- B items are mid-range contributors
- C items are low-value products that form the majority of SKUs but generate less revenue
- Velocity tiers: Groups SKUs by how quickly they sell.
- Fast movers require frequent monitoring, replenishment, and safety stock levels
- Medium movers show steady demand and require regular but less frequent replenishment
- Slow movers benefit from longer review cycles, minimal safety stock, and alternative strategies like bundling
This step ensures forecasting models are matched to the right product type instead of treating every SKU the same.
Step 3: Forecast model selection and software integration
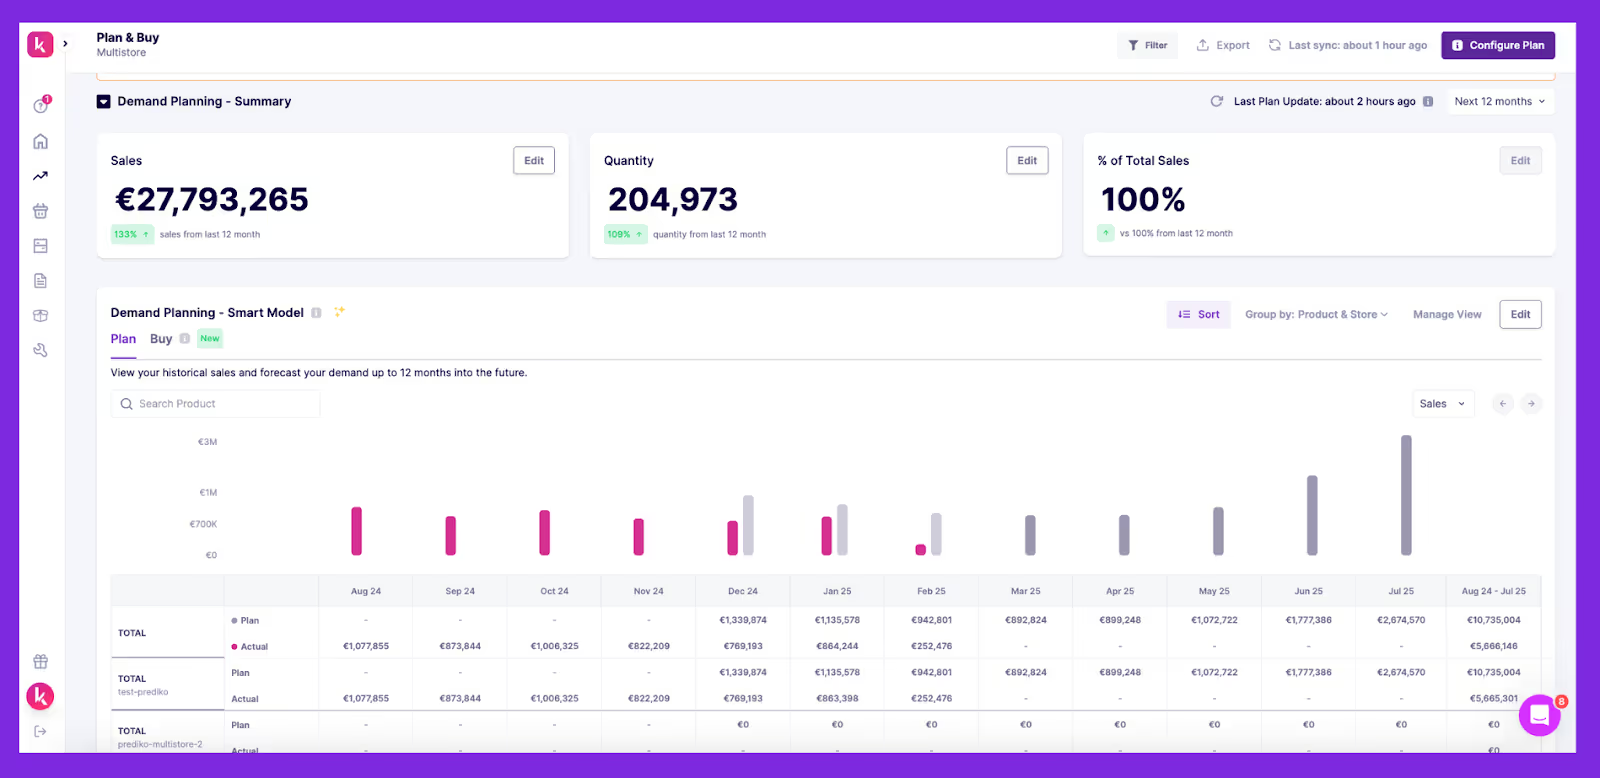
This step is about choosing the forecasting model you’ll use.
In theory, you could apply these models manually using spreadsheets. But the process is long, prone to errors, and nearly impossible to manage across hundreds of SKUs. That's why it's better to invest in a software.
Step 4: Forecast generation with safety stock and reorder points
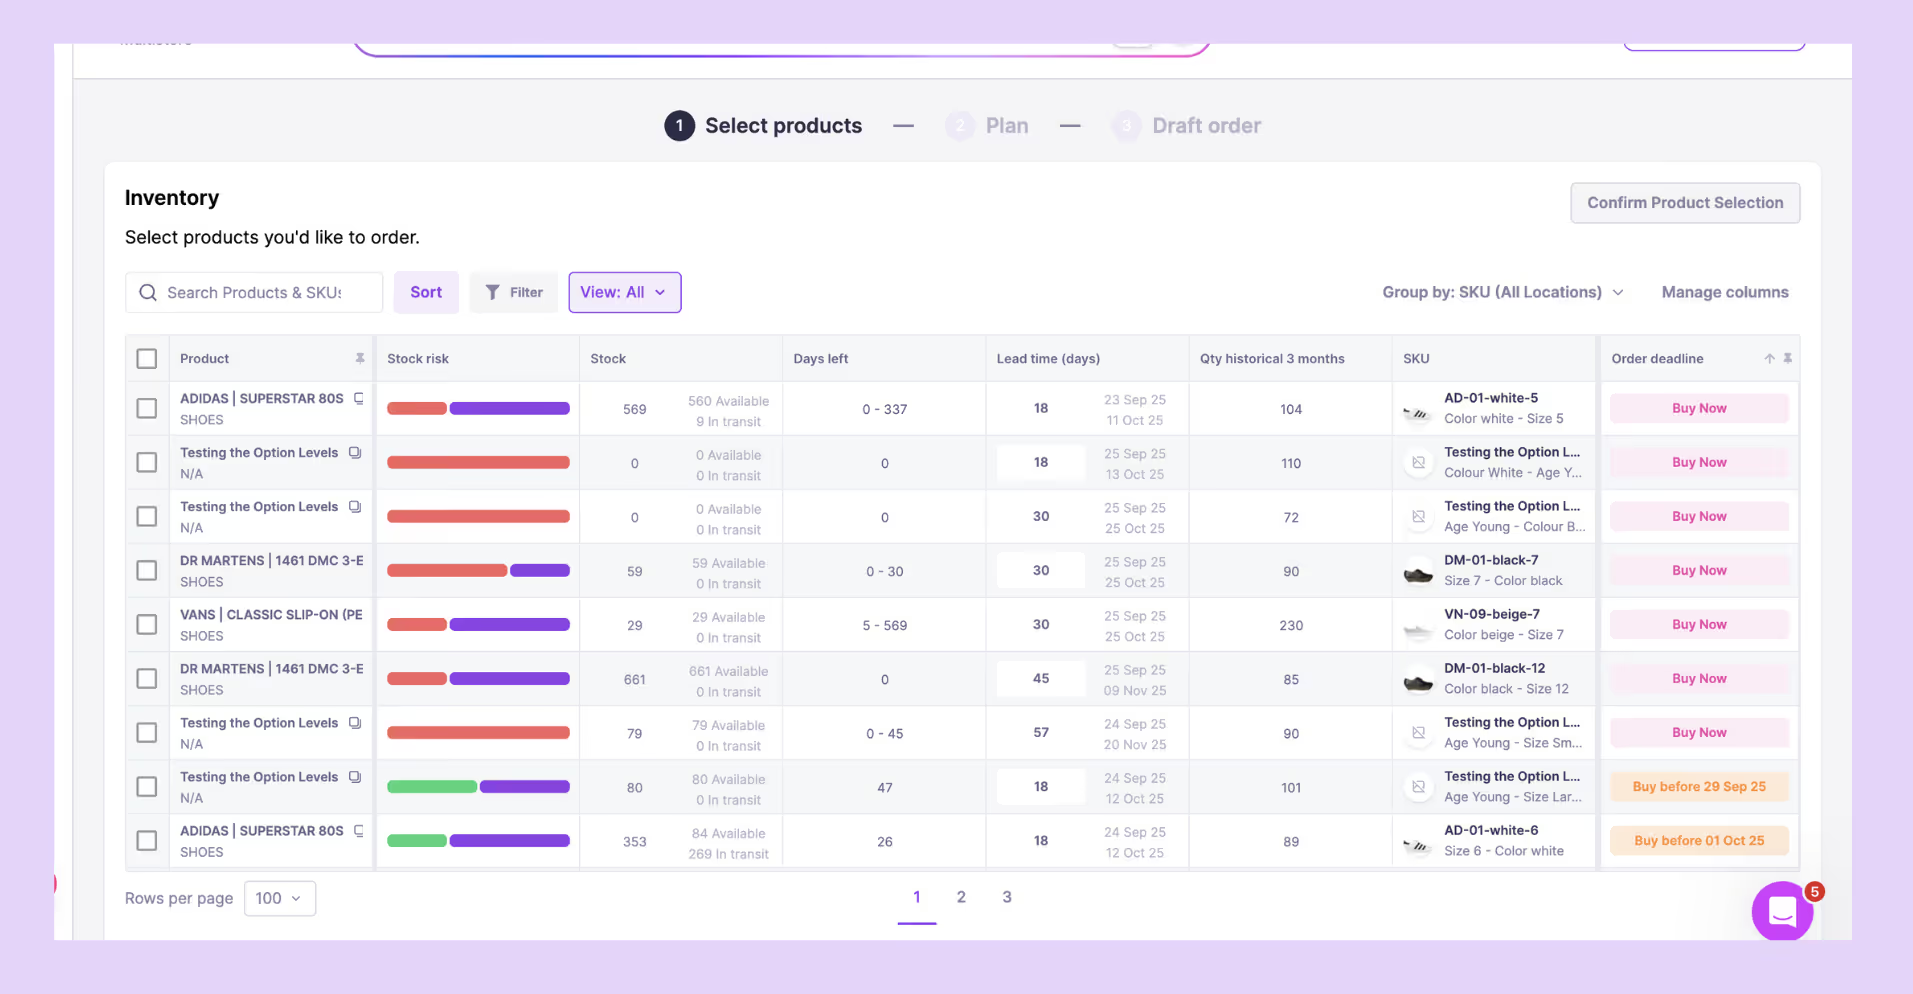
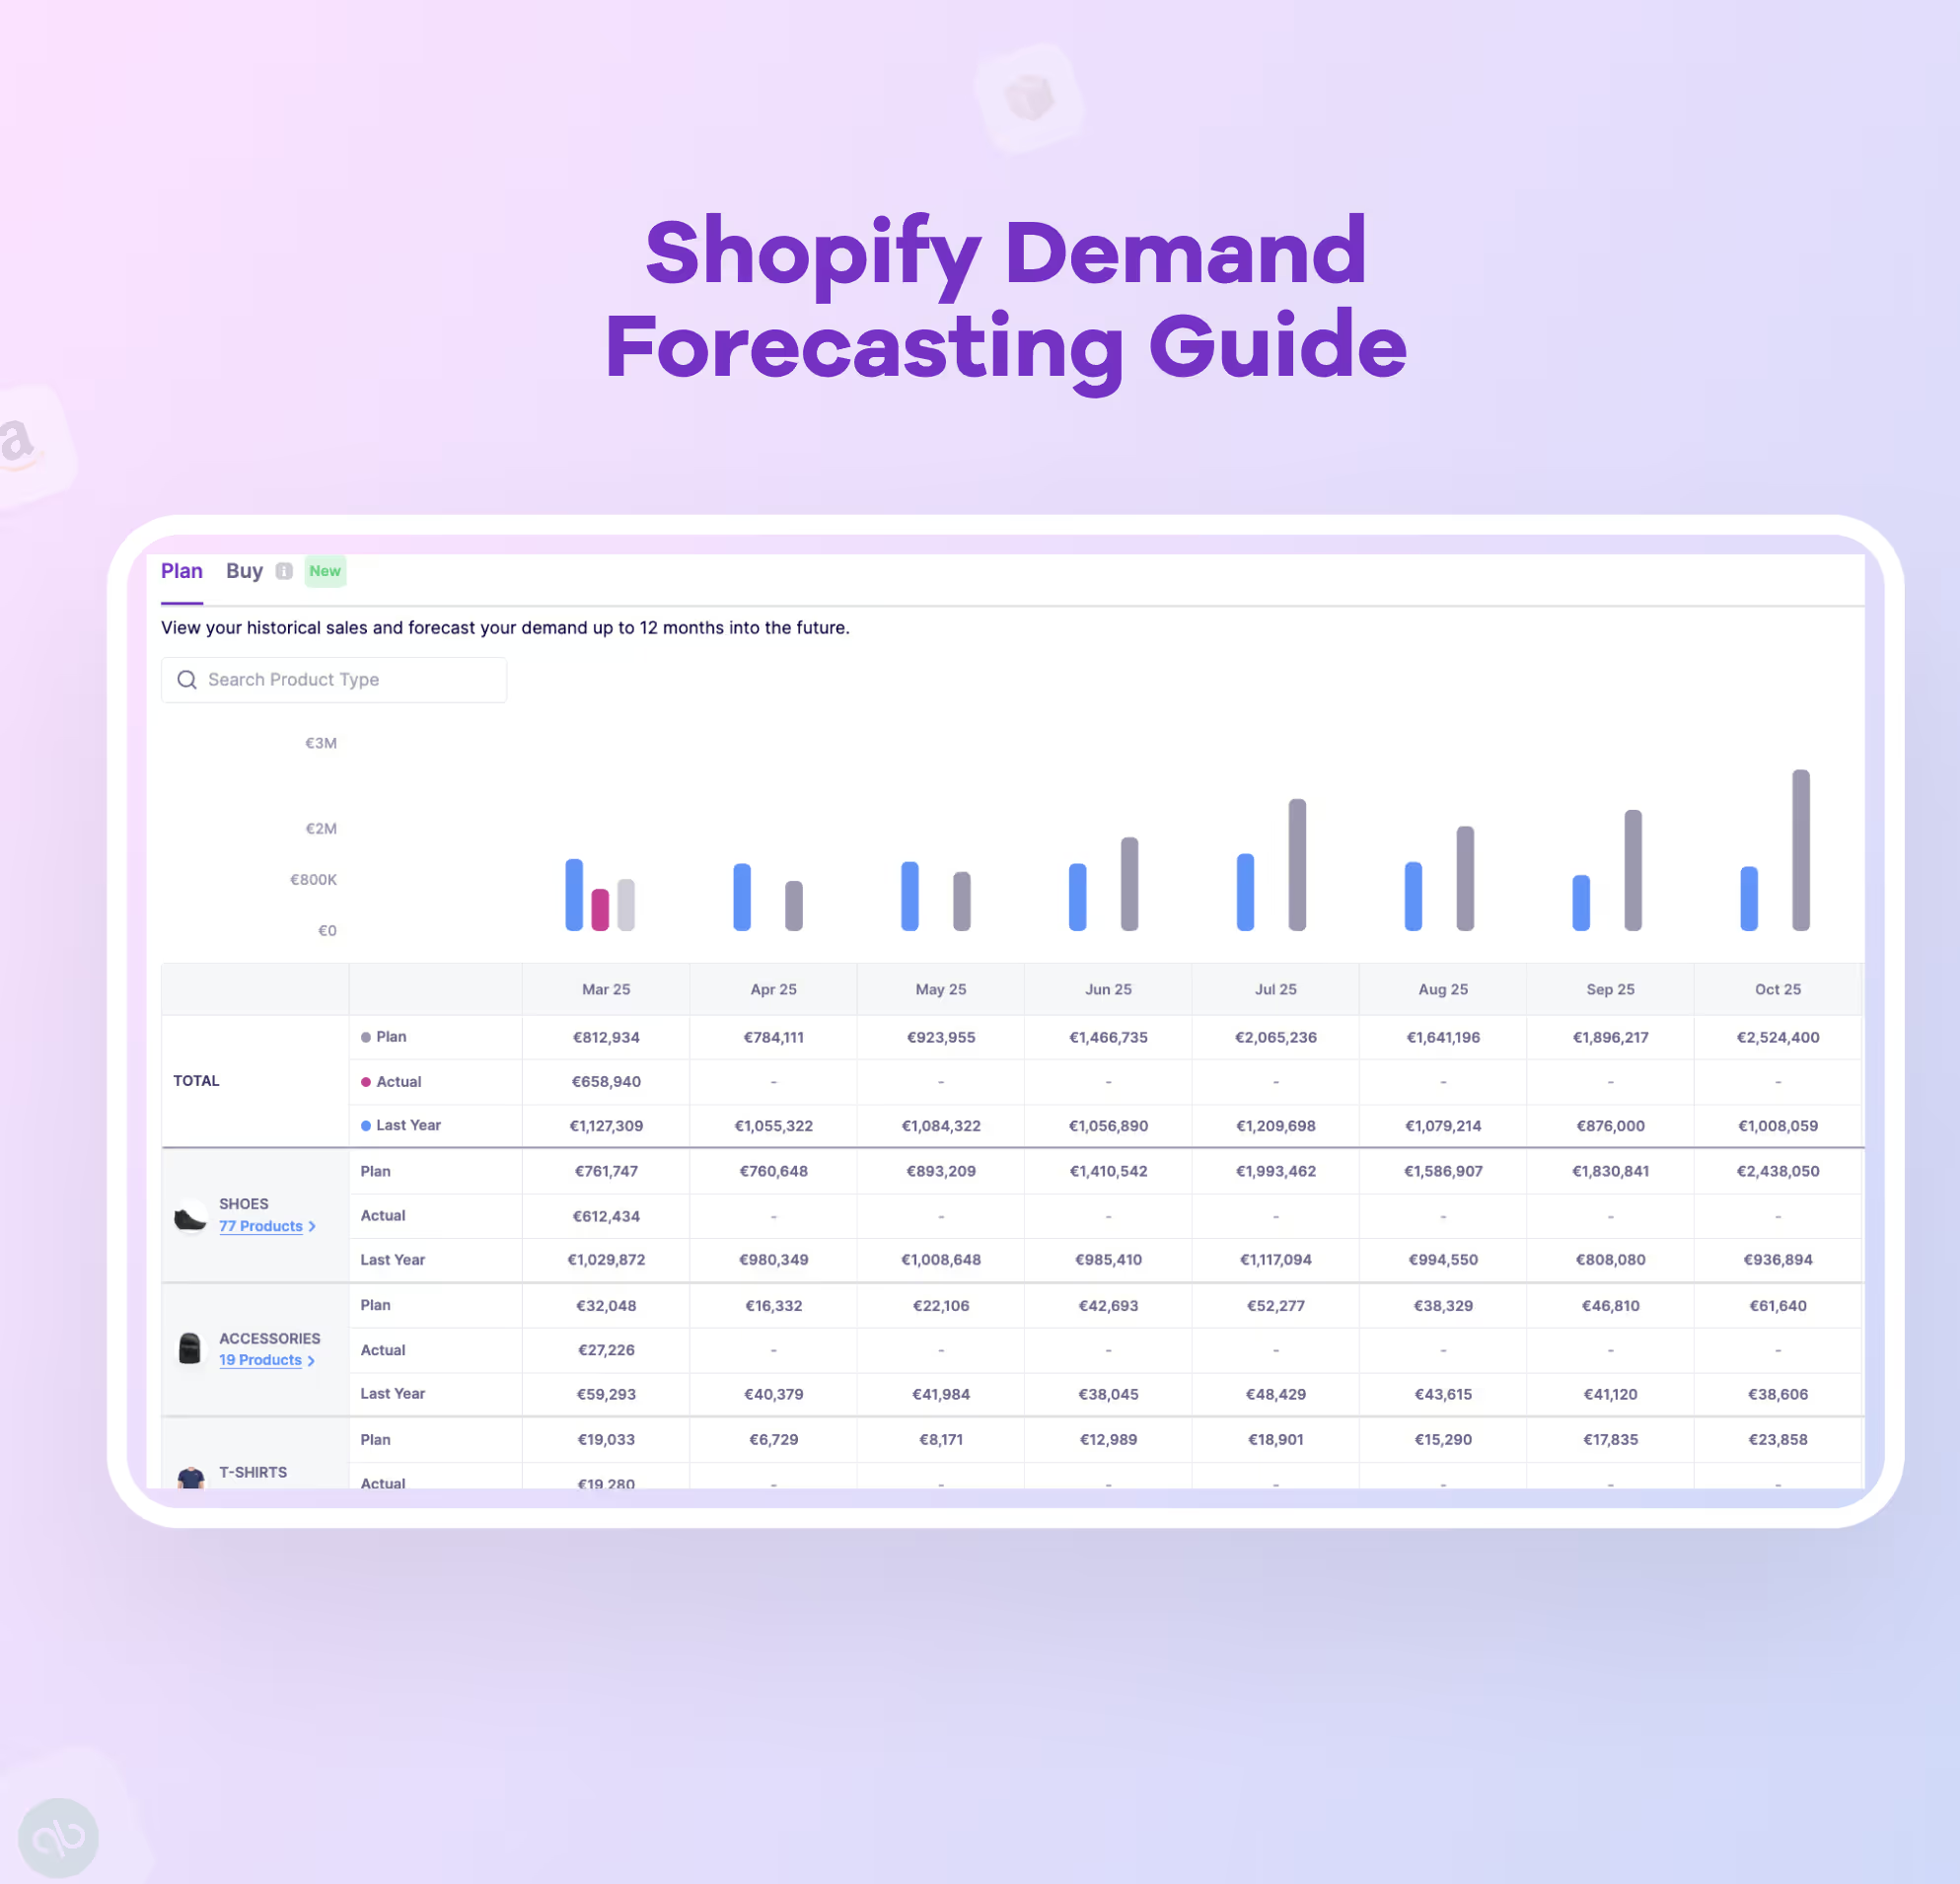
Once your forecasting software is integrated, it starts generating forecasts automatically, turning predictions into practical reorder decisions.
This means you always know exactly when to reorder and in what quantity, without manual tracking or static spreadsheet calculations.
Step 5: Accuracy tracking via dashboards and KPIs
Forecasts are only useful if you know how accurate they are. This step is about measuring accuracy and bias regularly to keep your forecasts reliable.
Demand planning metrics such as SMAPE (Symmetric Mean Absolute Percentage Error) and WMAPE (Weighted Mean Absolute Percentage Error) show how closely forecasts align with actual sales and highlight where adjustments are needed.
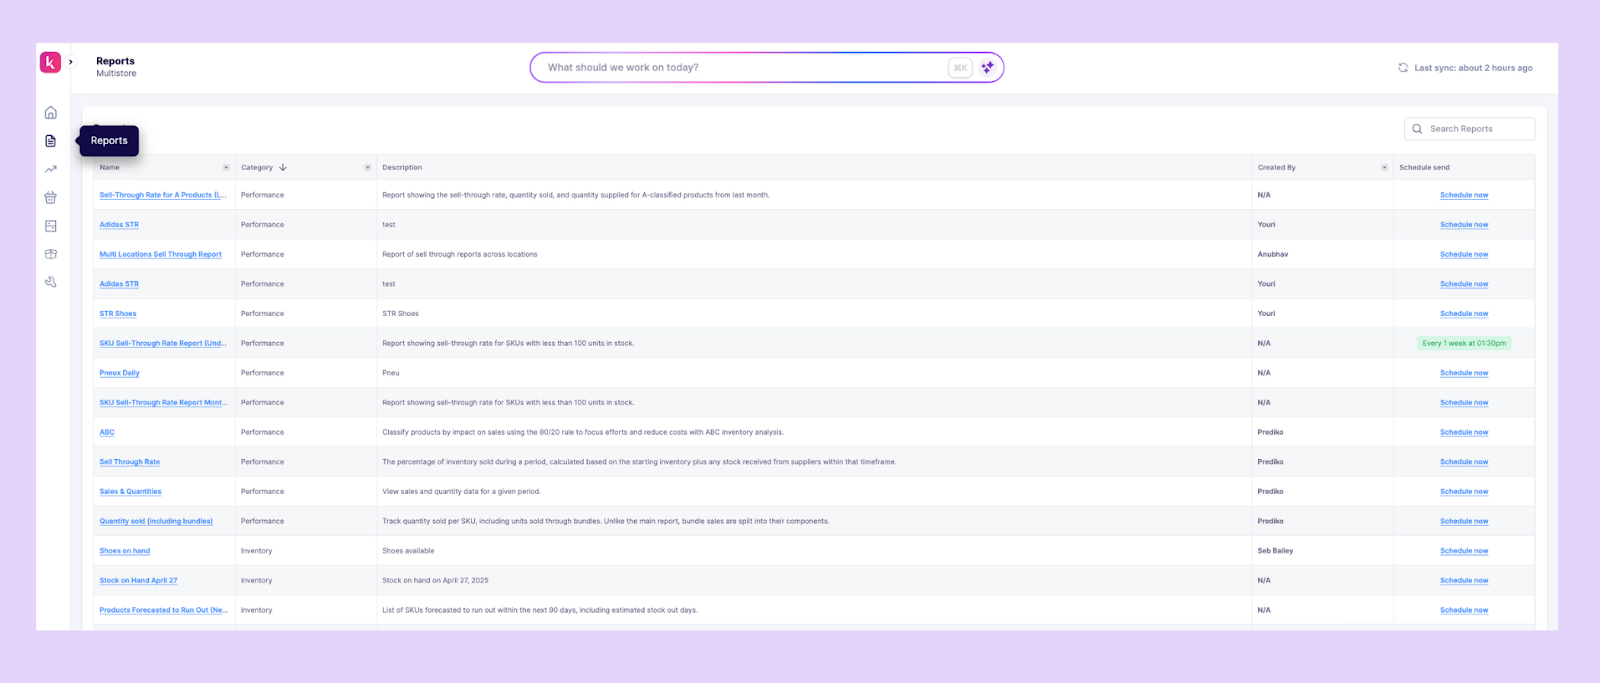
With software, you also get customizable SKU forecasting report templates, including sell-through rate, excess stock, ABC analysis, and multi-location tracking.
Step 6: Monthly reviews and adjustments
Forecasts aren’t meant to be set once and forgotten. Demand shifts with promotions, seasonality, and market changes, so regular reviews are essential.
By checking forecasts against actuals every month, you can spot patterns, correct bias, and prevent small errors from snowballing into stockouts or excess. This way, your forecasts stay accurate, adaptive, and always aligned with real demand.
Smarter SKU Forecasting Made Simple
Accurate SKU forecasting keeps inventory balanced, cash flow strong, and customers happy. But doing it manually or with basic tools is slow, complex, and error-prone.
With the right system, SKU forecasting goes from guesswork to a growth driver.











.avif)