


Imagine spending months aligning on your product strategy. You've stocked up, trained your team, prepped your marketing. Then the season hits, and your forecasts are off.
Maybe you over-ordered and you're sitting on dead stock. Maybe you under-ordered and missed weeks of sales on your best SKUs. Either way, the damage is real, and it traces directly back to forecast accuracy.
This article explains how to measure demand forecasting accuracy, which metrics actually matter, and how to systematically improve the numbers that drive your inventory decisions.
What Is Demand Forecasting Accuracy?
Demand forecasting accuracy is a measure of how closely your predicted demand matches actual sales over a defined time period.
It tells you how reliable your planning process is, not just whether your forecasts felt reasonable, but whether they held up against reality. High accuracy means your inventory decisions, reorder points, safety stock levels, and supplier commitments are built on solid ground. Low accuracy means you're either over-investing in stock you don't need or running out when demand is there.
Forecasting accuracy sits at the foundation of nearly every operational decision: what to order, when to order it, how much to produce, what to promote, and what to discount. When your accuracy degrades, those decisions compound into waste and lost revenue.
Common Demand Forecasting Accuracy Metrics
Different metrics are suited to different business contexts. Here's what each one actually measures and when to use it.
1. MAPE (Mean Absolute Percentage Error)
MAPE expresses forecast error as a percentage of actual demand. A MAPE of 15% means you were off by an average of 15% across your forecast periods.
Formula: MAPE = (1/n) × Σ(|Actual - Forecast| / Actual) × 100
MAPE is easy to understand and communicate, which makes it popular for reporting. But it has a significant flaw: it breaks down when actual values are zero or near zero. If a product has intermittent demand (which is common in long-tail SKUs), MAPE becomes unstable and can produce misleadingly high error values.
Use MAPE when your SKUs have consistent demand. Avoid it for slow-moving or seasonal products where zeros are common.
2. MAE (Mean Absolute Error)
MAE measures the average absolute difference between forecasted and actual values. Unlike MAPE, it's expressed in units, not percentages.
Formula: MAE = (1/n) × Σ|Actual - Forecast|
MAE is intuitive and easy to calculate. An MAE of 20 means you were off by an average of 20 units per period. It doesn't penalize large errors more than small ones (all errors are weighted equally), which is sometimes an advantage and sometimes a limitation.
Use MAE when you want a simple, unit-based measure of error that's easy to explain to non-technical stakeholders.
3. RMSE (Root Mean Square Error)
RMSE calculates the square root of the average squared differences between forecasted and actual values.
Formula: RMSE = √((1/n) × Σ(Actual - Forecast)²)
Because errors are squared before averaging, RMSE gives more weight to large errors. This makes it useful when big misses are disproportionately costly, like running out of stock on a high-margin SKU or significantly overbuying before a seasonal peak.
Use RMSE when you want to flag and penalize large forecast deviations, particularly on your highest-value SKUs.
4. Bias
Bias measures whether your forecasts systematically over-predict or under-predict demand.
Formula: Bias = (1/n) × Σ(Forecast - Actual)
A positive bias means you're consistently forecasting too high. A negative bias means you're forecasting too low. Even if your MAPE looks acceptable, persistent bias is a sign that something is structurally wrong with your forecasting approach.
Common sources of bias include over-optimistic sales targets fed into the demand plan, models that haven't been recalibrated after a shift in demand behavior, or manual overrides that consistently push forecasts in one direction.
Track bias alongside your error metrics. Error metrics measure how far off you are; bias tells you which direction you're consistently wrong.
5. WMAPE (Weighted Mean Absolute Percentage Error)
WMAPE weights the percentage error for each SKU by its revenue or volume contribution, so high-volume products count more in the final accuracy score.
Formula: WMAPE = Σ(|Actual - Forecast|) / Σ(Actual) × 100
This is a more practical metric for businesses with large catalogs. In a MAPE calculation, a 50% error on a product that sells 5 units counts the same as a 50% error on a product that sells 5,000 units. WMAPE corrects for this by proportionally weighting the contribution of each SKU.
Use WMAPE as your primary accuracy metric when managing a large, varied catalog where not all SKUs contribute equally to your business.
6. Forecast Value Added (FVA)
FVA measures whether each stage of your forecasting process actually improves accuracy, or makes it worse.
Formula: FVA = Error of Baseline Method - Error of Enhanced Method
FVA compares the error of your final forecast against a simple naïve baseline, typically the same period from last year or last week's actuals. If a step in your process (say, a manual override by a sales manager) increases error compared to the naïve baseline, it has negative FVA and should be removed.
Use FVA to audit your forecasting process and eliminate steps that add noise without improving accuracy.
What Is a Good Demand Forecast Accuracy Rate?
There's no universal benchmark. Accuracy varies by industry, product type, and the time horizon of the forecast.
As a rough guide:
- Weekly forecasts: 85-95% accuracy is achievable for high-velocity SKUs with stable demand
- Monthly forecasts: 80-90% accuracy is typical for mature products
- New product launches: 60-75% is realistic given limited data
- Long-tail SKUs: 50-70% is common due to intermittent demand
More useful than chasing a specific percentage is tracking whether your accuracy is improving over time and whether your errors are causing specific business problems: stockouts, excess inventory, or missed sales. The goal isn't a perfect score; it's minimizing the operational and financial impact of forecast error.
Common Causes of Poor Demand Forecasting Accuracy
Understanding why accuracy degrades is the first step to fixing it.
1. Stale or incomplete data
Forecast quality depends entirely on the quality of the inputs. If your sales data is delayed, your inventory records are inaccurate, or you're missing returns, cancellations, or channel splits, your forecasts will reflect those gaps.
Manual data collection and spreadsheet-based reconciliation are common culprits. When data flows through multiple systems before reaching the forecasting model, errors accumulate and timeliness suffers.
2. Ignoring seasonality and demand signals
Flat historical averages don't capture seasonal peaks, promotional uplifts, or gradual trend shifts. A model that treats last November the same as this November, without accounting for year-over-year growth or a planned promotional event, will miss the mark.
External signals, including weather, economic conditions, social media trends, and competitor activity, can also shift demand in ways that historical data alone won't predict.
3. One-size-fits-all models
Applying the same forecasting model to every SKU in your catalog is a common mistake. A steady-state SKU with 3 years of stable sales history requires a different approach than a new product launch or a seasonal item that sells for 6 weeks a year.
Accurate forecasting requires matching the model to the demand pattern: time-series models for stable demand, machine learning for complex patterns, and statistical methods designed for intermittent demand on slow-movers.
4. Unchecked manual overrides
Sales and commercial teams often push to override statistical forecasts with more optimistic numbers. Sometimes those overrides are correct and reflect local market knowledge. Often they introduce bias without any accountability mechanism.
If overrides consistently push forecasts above actuals without improving accuracy, they're a drag on performance. Forecast Value Added analysis can surface this.
5. Not measuring at the right level
Aggregate accuracy can look acceptable while SKU-level or location-level accuracy is actually poor. A brand might have 85% overall forecast accuracy but 60% accuracy on its top 10 revenue-driving SKUs, and those are the ones that cause stockouts.
Measure accuracy at the level at which decisions are made: by SKU, by location, or by channel, not just at the category or total revenue level.
How to Improve Demand Forecasting Accuracy
1. Establish a baseline and track it over time
Before you can improve accuracy, you need to measure it consistently. Pick a primary metric (WMAPE is a strong choice for most D2C brands), define the time period and granularity you'll track, and establish a baseline.
Without a consistent measurement approach, improvements are hard to verify and regressions are hard to catch.
2. Clean and centralize your data
Forecasting models are only as good as the data they run on. Audit your data sources for completeness and accuracy. Make sure sales data is captured at the channel and location level, that returns and cancellations are properly accounted for, and that inventory records are up to date.
For Shopify brands, this means connecting your demand planning tool directly to your store so data is always current, rather than working off exports that are days or weeks old.
3. Segment your SKUs and apply the right model
Group your products by demand pattern: high-volume stable demand, seasonal, trend-driven, new launches, and intermittent. Apply forecasting models suited to each group rather than forcing all products through the same approach.
Prediko automatically applies appropriate forecasting logic by SKU type, accounting for seasonality, growth trends, and demand velocity without requiring manual configuration.
4. Build in external signals and event calendars
Incorporate known demand events into your forecasts: promotional calendars, planned media spend, seasonal peaks, and major external events. Treat these as inputs to the demand model rather than adjustments made after the fact.
For signals you can't fully quantify, such as a new product category entering your market or an unusual weather pattern, maintain a process for reviewing and manually adjusting forecasts at a SKU level with documented reasoning.
5. Run Forecast Value Added analysis
Map out every step in your current forecasting process: statistical model outputs, consensus reviews, management overrides, final sign-off. Measure the error at each stage and compare it to a naïve baseline.
Remove or redesign any step that consistently makes accuracy worse. This is particularly relevant for businesses where sales or commercial teams have significant influence over the final forecast numbers.
6. Tighten the feedback loop
Forecasting improves when planners can see, quickly, where their forecasts were right and where they were wrong. Short feedback loops (weekly or bi-weekly actuals vs. forecast reviews) allow for faster model adjustments and help planners build intuition about which products and time periods are hardest to forecast.
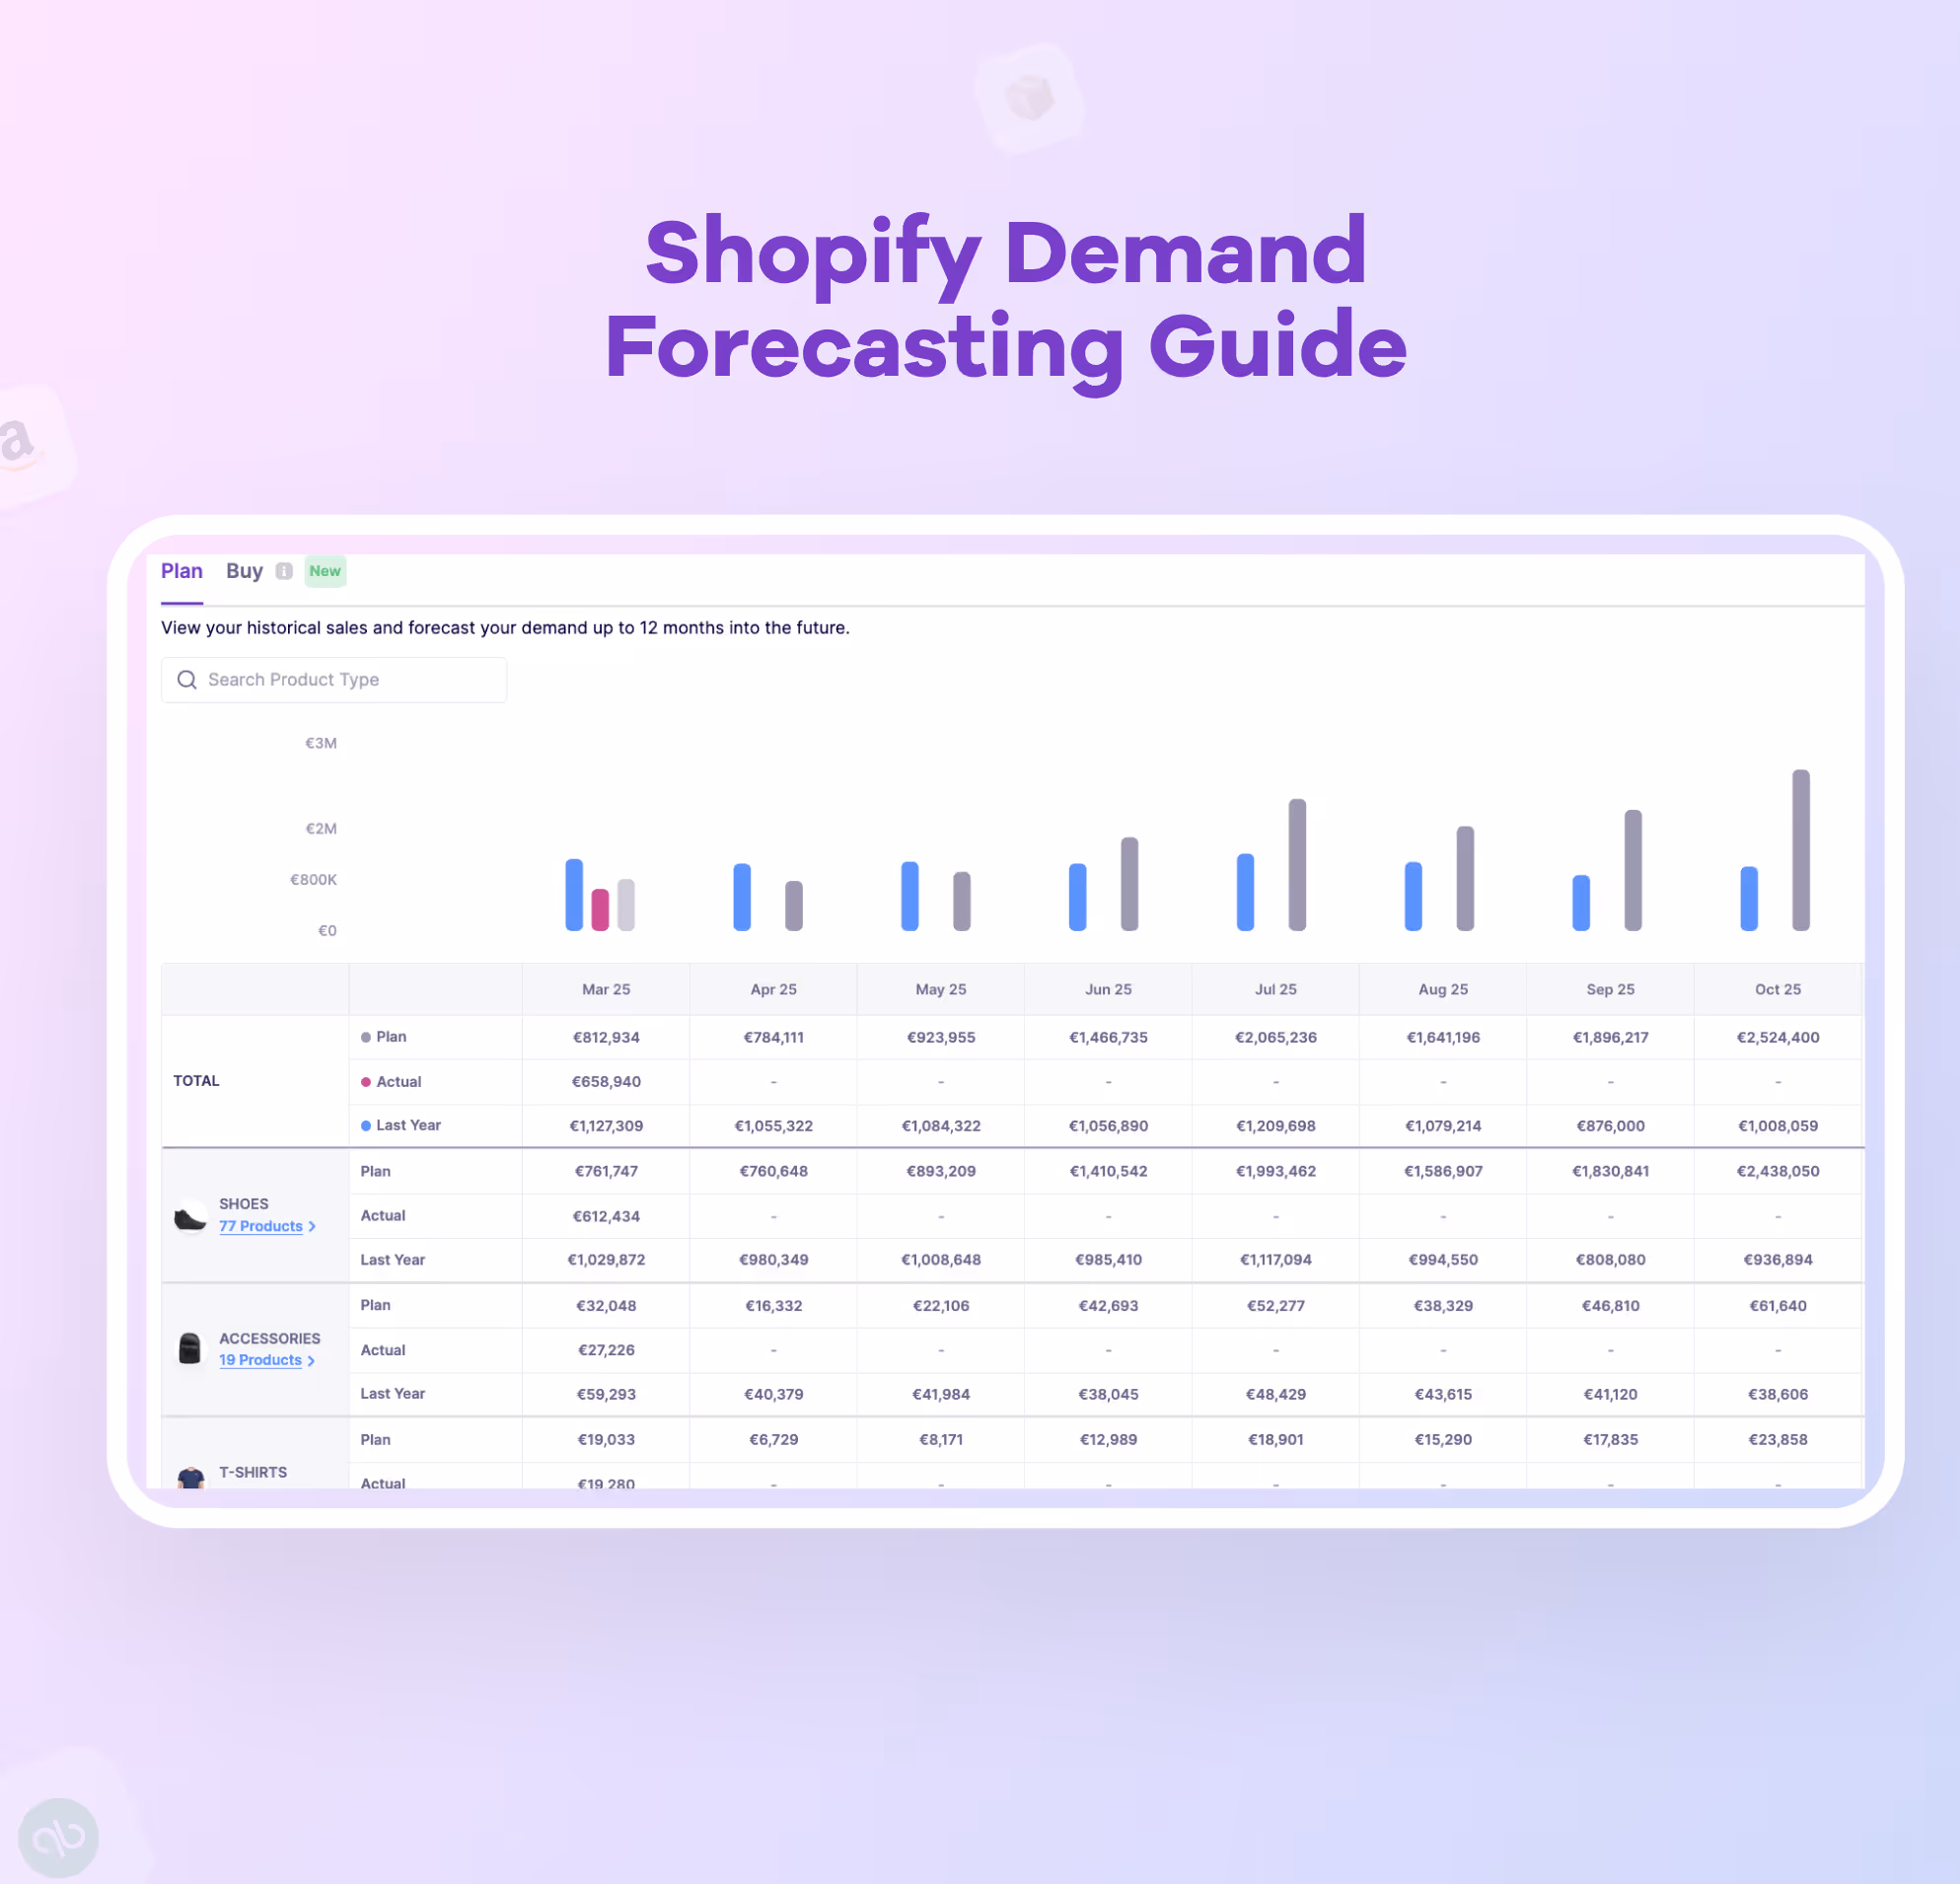
Prediko's plan vs. actuals tracking makes this visible without manual reporting. Planners can see where the forecast diverged from sales in real time and adjust the demand plan accordingly.
7. Use AI to detect patterns humans can't
At scale, human planners can't monitor thousands of SKUs simultaneously. AI-powered forecasting tools detect subtle patterns in demand data, including slow velocity shifts, emerging seasonality signals, and the influence of external variables, that spreadsheet-based approaches miss entirely.
Prediko's AI is trained on millions of SKUs across multiple industries, giving it a foundation for pattern recognition that's continuously refined by actual demand outcomes.
How Prediko Improves Demand Forecasting Accuracy
Prediko is built for Shopify brands that need accurate, SKU-level demand forecasting without the overhead of enterprise planning tools.
Real-time Shopify data sync
Prediko connects directly to Shopify and pulls live sales, inventory, and purchase order data continuously. There are no manual exports, no data pipelines to maintain, and no lag between what's happening in your store and what the forecast model sees.
AI trained on millions of SKUs
The forecasting AI has been trained on over 25 million SKUs across 15+ industries. This gives it a broad baseline for recognizing demand patterns, handling seasonality, and adjusting for growth trends, even on products with limited sales history.
SKU-level forecasting with location and channel granularity
Prediko generates forecasts at the individual SKU level, broken down by location and channel where relevant. Aggregate accuracy is tracked, but decisions are driven by granular forecasts that reflect where demand is actually occurring.
Seasonality and trend detection
The model automatically identifies seasonal demand patterns and applies them to future forecasts. For brands with strong seasonal peaks (holiday, summer, back-to-school), this significantly reduces the error that comes from applying flat historical averages.
Editable demand plans
Planners can review and adjust Prediko's AI-generated forecasts at the SKU level, incorporating knowledge about upcoming campaigns, product launches, or market conditions that the model may not fully capture. Adjustments are logged so their accuracy can be tracked over time.
Plan vs. actuals tracking
Prediko compares forecast performance against actual sales on an ongoing basis. The platform surfaces SKUs where accuracy is degrading, allowing planners to investigate and adjust before errors cascade into inventory problems.
Forecasting Accuracy and Inventory Performance
Forecast accuracy is a means to an end. The real measure is what happens to your inventory as a result.
High accuracy enables:
- Tighter safety stock levels without increasing stockout risk
- More precise reorder points that don't require large buffers to compensate for planning uncertainty
- Fewer emergency orders and air freight costs triggered by unexpected stockouts
- Better supplier relationships and pricing from more predictable order volumes
- Healthier cash flow from reduced overstock and markdowns
The business case for improving forecast accuracy isn't abstract. Every percentage point of improvement reduces the inventory buffer you need to carry, which directly frees up working capital.
Measuring and improving your demand forecasting accuracy is one of the highest-leverage activities available to inventory teams. The metrics, MAPE, WMAPE, MAE, RMSE, bias, and FVA, give you the diagnostic tools to understand where your process is breaking down. The fixes, better data, appropriate models, external signals, and tighter feedback loops, are all achievable with the right tooling and process discipline.
For Shopify brands, Prediko provides an integrated environment where accurate SKU-level forecasting connects directly to purchasing decisions, with continuous monitoring and tracking of inventory flow to ensure that forecast improvements translate into better inventory levels, cash flow, and service rates. Poor accuracy leads to overstock, stockouts, or both.