

A 10% improvement in demand prediction accuracy can cut inventory costs by up to 30%. That kind of impact shows just how crucial a precise, responsive demand planning process really is.
At the core of that process are your demand planning KPIs; the signals that reveal whether your forecasts match reality, your inventory is balanced, and where breakdowns may exist in your supply chain.
But with so many KPIs to choose from, the real challenge is knowing which ones actually matter. Which metrics give you the clearest picture of your demand? And how do you know they’re right for your business?
We share most essential demand planning metrics and explain why they’re worth tracking.
Understand Demand Planning in eCommerce
Demand planning is the process of forecasting customer demand to ensure that inventory, production, and distribution align with market needs.
It involves analyzing data, tracking trends, and collaborating across teams to anticipate fluctuations and stay ahead.
The goal? To strike the right balance between supply and demand, so your products are available when and where customers want them, without overstocking or stockouts.
Key aspects of demand planning in eCommerce include
- Forecasting based on historical data and market trends
- Coordinating inventory levels across multiple sales channels
- Aligning production schedules with promotions and seasonal peaks
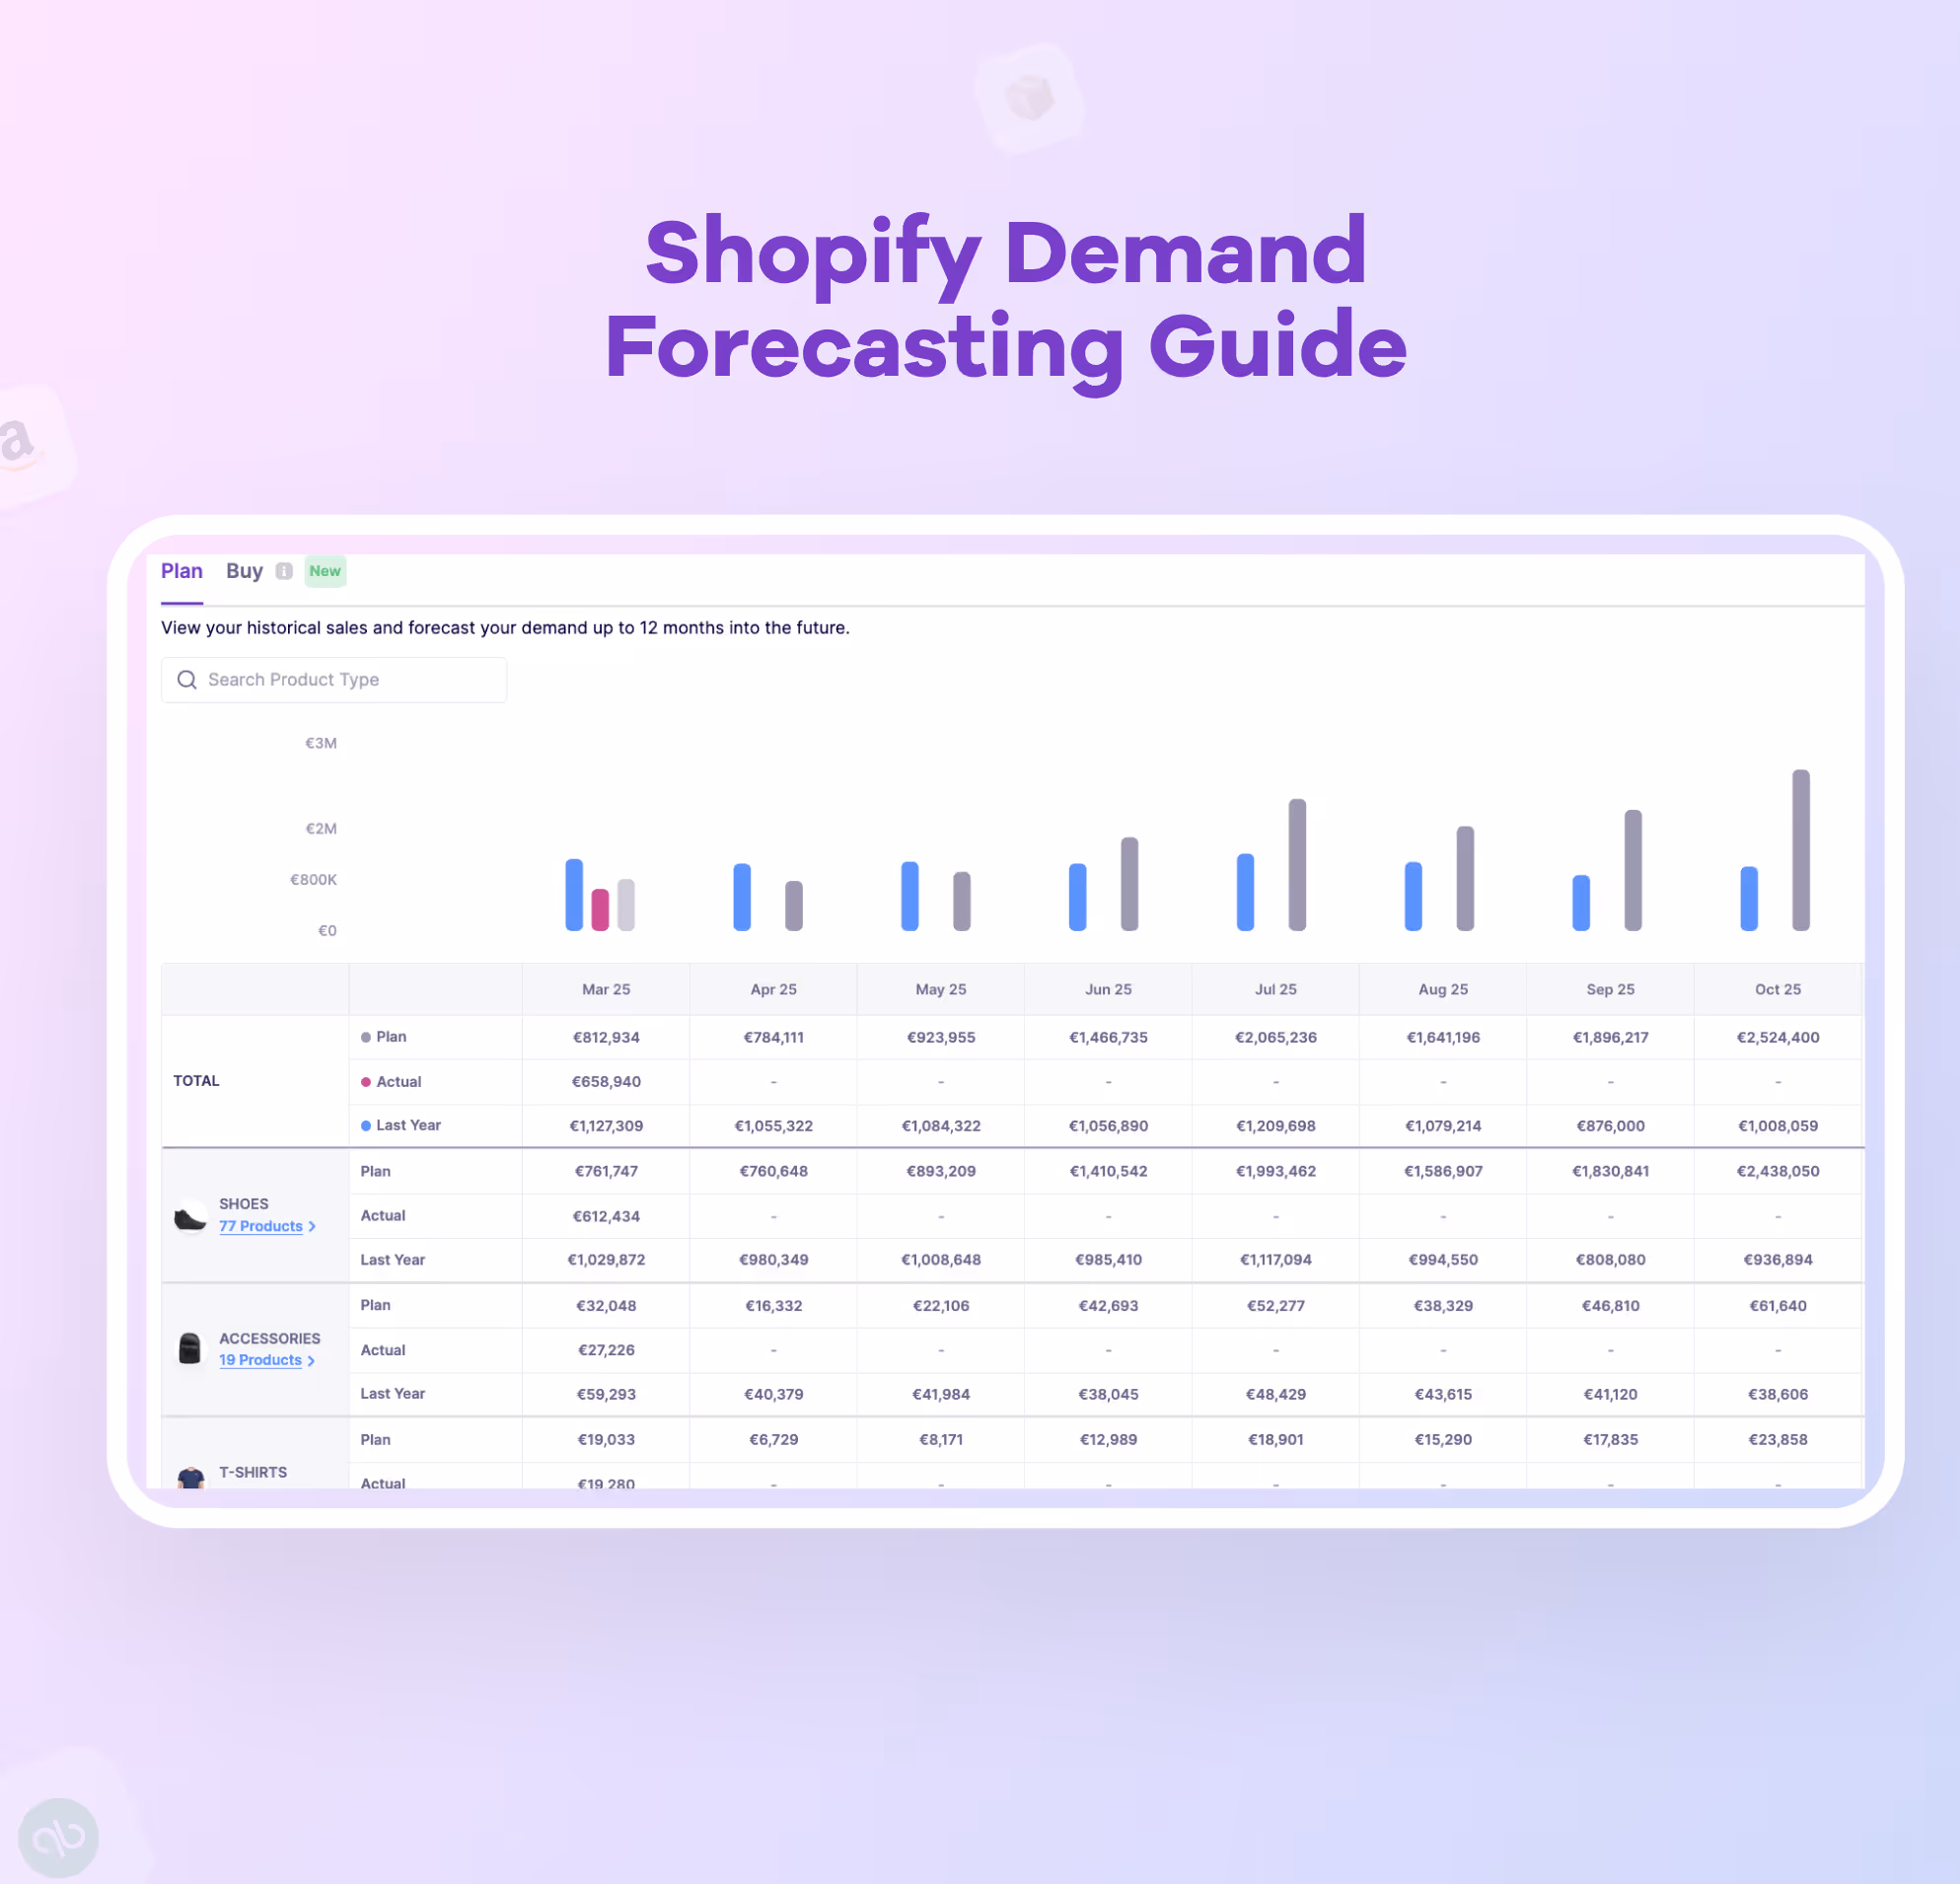
Explore this full guide to demand planning and forecasting, built specifically for Shopify stores.
What are Demand Planning KPIs?
Demand planning KPIs are performance metrics that help businesses evaluate how well their forecasting and inventory planning processes are working.
These KPIs provide insights into demand trends, stock levels, and supply chain responsiveness, making them essential for balancing supply with customer demand.
For eCommerce and Shopify brands, these KPIs include forecast accuracy, inventory turnover, stockout rate, and service level among others.
Importance of Demand Planning KPIs and Metrics
Metrics and KPIs in demand planning play a much bigger role than most Shopify merchants realize.
Here’s how tracking the right metrics helps.
1. Visibility into demand patterns
Demand planning KPIs help you uncover demand trends like when certain SKUs sell faster (e.g., seasonal peaks), which variants perform better, and which channels bring the most volume.
This kind of visibility allows you to allocate inventory more intelligently, so that your best sellers are always stocked in the right locations and slow movers don’t tie up warehouse space.
2. Detecting demand swings early
Metrics such as demand variability and forecast accuracy highlight sudden changes in buying behavior.
If you notice a spike in a product’s daily velocity or a widening gap between forecasted vs. actual sales, it’s a signal that demand is shifting.
Catching these swings early can prevent costly mistakes, like missing a trend or holding too much of a slow-moving product.
It also allows for faster reaction, whether that means adjusting marketing, pausing reorders, or reallocating inventory across locations.
Learn more about key inventory allocation strategies.
3. Improving forecast accuracy
Demand planning KPIs like Mean Absolute Percentage Error (MAPE), Forecast Bias, and Weighted Forecast Accuracy (WFA) reveal how close your predictions are to reality.
Over time, tracking these metrics helps you refine your forecasting models, especially when you account for things like promotions, holidays, and campaigns common in DTC.
More accurate forecasts lead to better planning, less capital tied up in excess inventory, and fewer out-of-stock notices for customers.
4. Identifying supply chain bottlenecks
Even if your forecasts are spot on, fulfillment problems can derail your operations.
By tracking metrics like supplier lead time variability, PO delays, or fill rate, you can identify friction points in your supply chain. Maybe a supplier is consistently late, or a warehouse isn’t shipping fast enough.
These insights help you intervene early, whether it’s switching suppliers, building more safety stock, or using multiple fulfillment centers to reduce delays.
Key Metrics for Effective Demand Planning
Now that you know how metrics support your demand planning efforts, here are the key metrics you must track and why.
1. Forecast accuracy
Forecast accuracy measures how well your demand forecasts align with actual sales.
In eCommerce where trends, seasons, and external events can cause rapid demand shifts, this metric is crucial for avoiding costly stockouts or overstocking.
A widely used method to measure forecast accuracy is Mean Absolute Percentage Error (MAPE).
It calculates average percentage difference between your forecast and actual sales, giving you a clear sense of how far off your projections are.
Formula to calculate: MAPE = (1/n) × Σ(|Actual - Forecast| / Actual) × 100
Where n = number of forecast periods, Actual = actual demand, Forecast = predicted demand
Lower MAPE values indicate higher accuracy.
Regularly tracking this metric helps you spot patterns of over- or under-estimation, refine your forecasting models, and build greater confidence in decisions around purchasing, stocking, and promotions.
Check out how to improve demand forecasting accuracy for your Shopify store.
2. Inventory turnover
Inventory turnover measures how often you sell and replace your stock within a given time period.
A high turnover rate typically reflects efficient inventory planning and strong demand, while a low rate may point to overstocking, misaligned buying, or weak product performance.
Formula to calculate: Inventory Turnover = Cost of Goods Sold (COGS) / Average Inventory
To improve your turnover, regularly review slow-moving SKUs, fine-tune order quantities, and align replenishment cycles with demand forecasts.
This helps reduce carrying costs, avoid excess stock, and redirect capital toward faster-moving, revenue-driving products.
3. Service level
Service level measures the percentage of customer demand fulfilled without delays, backorders, or stockouts. In eCommerce, where instant availability is expected, maintaining a high service level is crucial for customer satisfaction and retention.
Formula to calculate: Service Level (%) = (Orders Fulfilled on Time / Total Customer Orders) × 100
Achieving a strong service level means striking the right balance between product availability and inventory carrying costs.
Accurate safety stock calculations and real-time inventory monitoring help maintain this balance so customers can always find what they’re looking for, exactly when they need it.
4. Lead time variability
Lead time variability measures fluctuations in the time it takes suppliers to deliver stock. Unpredictable lead times can disrupt even the best forecasts, leading to stockouts or excess safety stock.
Formula to calculate: Lead Time Variability (%) = ((Max Lead Time – Min Lead Time) ÷ Avg Lead Time) × 100
Reducing variability involves building strong supplier relationships, negotiating more reliable delivery schedules, and using dual sourcing strategies.
Tracking this metric alerts you about supplier performance issues before they impact customers.
5. Stock-out rate
Stockout rate indicates how frequently products are unavailable when customers try to purchase them. It is a critical signal for missed revenue opportunities and declining customer trust.
Formula to calculate: Stockout Rate (%) = (Number of SKUs Out of Stock / Total Number of SKUs) × 100
Reducing stockouts requires continuous demand monitoring, accurate forecasting, and dynamic replenishment processes.
Stockouts don’t just mean lost sales. Dive deeper into the hidden costs of stockouts.
Advanced Demand Planning KPIs and Metrics
As demand planning matures, basic metrics aren’t enough to capture the complexity of modern supply chains.
Advanced metrics take you deeper especially when powered by AI and analytics in demand planning. When you’re at that level, here are the metrics to track.
1. Demand sensing
Demand sensing is the process of using real-time data to detect and respond to short-term shifts in demand.
Unlike traditional forecasting, which often relies on historical trends, demand sensing reacts to actual market signals. like social media buzz, weather changes, or competitor activity.
It typically focuses on a 4–8 week horizon and pulls in data from multiple sources to generate dynamic, near-term forecasts.
While there’s no fixed formula, the goal is to use advanced analytics to adapt quickly to changing customer behavior and market conditions.
Prediko makes this possible by continuously feeding real-time sales and inventory data into its AI algorithm, adjusting reorder recommendations as demand patterns shift.
It also allows manual overrides to the AI-generated plan for external factors, like an upcoming campaign or supply disruption, that the data alone might miss.

2. Contribution margin analysis
Contribution margin shows how much a product generates after covering variable costs (COGS, shipping, payment fees).
For demand planning, analyzing this allows you to prioritize SKUs with the highest contribution margin.
This helps you allocate inventory and working capital to the products that drive the most profit, not just the most volume.
3. Lost sales rate
Lost sales rate estimates the revenue missed because items were out of stock when customers tried to buy them.
A rising lost-sales rate signals gaps in forecasting, safety-stock settings, or replenishment speed that need immediate attention.
P.S., Here is how replenishment planning can be done for Shopify stores.
Prediko shows your daily estimated revenue loss for understocked SKUs, so you know exactly how much each stockout is costing you and which products to prioritize first.

4. Planned vs. Actual reorder cadence
This metric compares the schedule you planned (ROPs, reorder cycles) with the actual dates you placed purchase orders.
Frequent deviations point to mismatched lead times, supplier delays, or forecast errors. Closing this gap tightens cash flow, reduces emergency air-freight costs, and ensures on-time availability.
Prediko gives you clear visibility into planned vs. actual purchase quantities and sales. It also shows exactly when each PO was placed and its current status, so you can stay ahead of delays.

Implementing Metrics in Your Demand Planning Process
Implementing metrics in demand planning goes beyond just collecting data. It’s about building a system where insights guide every move, from forecasting to replenishment.
Here’s how you can integrate demand planning performance metrics effectively into your workflow.
Step 1: Define your core demand planning KPIs and metrics
Start by identifying the key metrics that align with your business goals. These typically include forecast accuracy (MAPE), inventory turnover, service level, and stock-out rate.
The right metrics vary depending on your product type, sales channels, and growth stage. Defining them upfront helps your team stay focused instead of drowning in data.
Step 2: Connect data sources for real-time visibility
Demand planning metrics lose their value if they’re based on outdated or incomplete data.
Integrate your demand planning software with live data sources, such as Shopify sales, WMS platforms, and supplier lead times, to ensure your metrics reflect current realities.
This helps you detect changes in demand faster and react more confidently.
Prediko pulls live data directly from your Shopify stores and warehouses. It updates your dashboards in real time which means no more manual data uploads or worrying about syncing multiple systems.
Your metrics are always current and ready to guide your decisions.

Step 3: Embed metrics into workflows and act on them
Don’t let metrics sit in a dashboard. They only create value when they lead to decisions so make them part of your everyday processes.
Integrate key metrics like forecast accuracy, turnover, and stock-out rate into your workflows and establish them as triggers for action.
Set benchmarks, create alerts for exceptions, and use these insights to fine-tune your purchase decisions, allocation strategies, and reorder timing.
For example, if your stock level drops below target, that should prompt you to reorder before it impacts customer satisfaction and inflates your stock out rates.
This keeps metrics active in your process instead of turning them into passive numbers.
With Prediko, you receive alerts for low-stock SKUs and delayed POs, track sell-through rates, and view estimated losses from stockouts, so you’re always one step ahead.
Step 4: Review & improve regularly
Over time, demand planning metrics can lose relevance if they are not reviewed against changing business needs and market conditions.
Seasonal demand shifts, new product lines, or supplier changes can all impact how KPIs should be measured and applied.
To address this, set scheduled reviews where teams analyze whether current metrics still reflect business priorities.
Use these sessions to adjust targets, refine calculation methods, and align processes with updated goals. Regular reviews ensure your demand planning stays accurate and responsive as your operations evolve.
Challenges in Using Demand Planning KPIs
Working with demand planning metrics isn’t always straightforward. Here are some common challenges and how to navigate them effectively.
1. Data quality issues
Metrics are only as reliable as the data behind them.
Inaccurate sales, missing supplier lead times, and outdated stock records can lead to misleading insights.
This creates a ripple effect; overestimating demand leads to excess stock, while underestimating it results in costly stockouts.
Solution
Audit your data regularly. Make sure your sales, inventory, and supplier data are accurate and up to date.
Automate data collection from respective systems to reduce manual mistakes.
Use tools like Prediko that pull real-time data directly from your Shopify store and centralize inventory, purchasing, and demand data in one place to reduce manual errors.
Set up alerts for anomalies in key inputs like lead times or demand spikes to ensure metrics stay relevant.
2. Too many metrics to track
Modern demand planning systems can generate dozens of KPIs.
While all these metrics offer valuable insights, teams often struggle to separate the critical ones from the nice-to-haves.
As a result, dashboards become overloaded with data, making it difficult for you to identify which metrics need immediate attention.
This overload can lead to conflicting priorities, slower decision-making, and missed opportunities to address actual demand shifts.
Solution
Identify a core set of metrics tied to business priorities, such as forecast accuracy, service level, and stock-out rate.
Limit reporting to these while keeping secondary metrics as supporting data.
Prediko makes this easy with 20+ ready-to-use report templates focused on high-impact metrics. You can also customize or build your own templates based on your goals, so your team always tracks what actually moves the needle.

3. Lag in metric updates
Many businesses still work with metrics that are updated weekly or even monthly. In a fast-moving market, that delay means you’re reacting to problems only after they’ve caused stockouts or excess inventory.
This time lag creates blind spots for you. By the time the numbers show a demand spike, customers may have already turned to competitors.
Solution
Instead of relying on static reports, shift to systems that provide live or near-real-time data.
With up-to-date insights, teams can make decisions as demand changes. This keeps planning aligned with what’s really happening in your supply chain.
Prediko sends daily and weekly inventory reports straight to your inbox, keeping you in the loop with real-time insights.

Track Demand Planning KPIs and Metrics With the Right Tools
Tracking the right metrics helps you plan with confidence. It reduces forecasting errors, prevents stockouts, keeps inventory levels healthy, and improves overall supply chain performance.
Prediko makes this easier by offering real-time AI-powered demand planning KPIs, so no more manual calculations or spreadsheet hopping.
Start using metrics the smart way and take your demand planning from reactive to proactive with Prediko. Start your free 14-day trial today.
FAQs
What are demand planning KPIs?
These are the key metrics that measure the success of your demand planning process, like forecast accuracy, inventory turnover, and stock-out rate.
How to calculate demand planning?
To calculate demand planning, analyze historical sales data, identify seasonal trends, and factor in variables like promotions and market shifts to forecast future demand using statistical or AI models.
How to calculate demand planning accuracy?
Use Mean Absolute Percentage Error (MAPE) to find the average difference between forecasted and actual demand.
What are the KPI metrics for S&OP?
Common KPI metrics include forecast accuracy, service level, production adherence, and inventory days of supply.