

Baking a cake isn't just about following one recipe. The ingredients, oven temperature, and even the humidity in your kitchen can change the outcome.
Experienced bakers adjust depending on the situation.
Inventory forecasting works in much the same way. No single method delivers perfect results for every SKU. Some products sell in steady streams, others surge during promotions, and some stay dormant until demand suddenly kicks in. Each requires a different approach.
We'll explore the main inventory forecasting techniques, when to use each one, and show how combining methods can create a more effective approach.
Why Choosing the Right Inventory Forecasting Technique Matters
Inventory forecasting isn't one-size-fits-all. The right technique depends on demand pattern you're managing. Using the wrong approach means your forecast won't reflect reality, leaving you with excess stock or shortages.
A few demand patterns you'll see across SKUs include
- Trend, where sales steadily move upward or downward
- Seasonality, where demand rises and falls at predictable times of the year
- Promotions, where demand spikes in short bursts
- Intermittent demand, where orders arrive irregularly with gaps in between
The technique you choose has to match the data behind each Shopify SKU. That means looking at the length of your sales history, how volatile the demand is, and whether the data is sparse or rich.
Core Inventory Forecasting Techniques Explained
We'll now break down the most effective forecasting techniques in inventory management, how they work, and the scenarios where each one makes the most sense.
1. Moving average and exponential smoothing
These are quantitative methods best suited for products with stable or seasonal demand. A moving average forecasts the next period by taking the average of a set number of recent periods.
It smooths out random fluctuations but gives equal weight to all past data, which can make it slow to react to sudden shifts.
Exponential smoothing improves on this by assigning more weight to recent data, allowing forecasts to adjust more quickly to short-term changes.
Pros
- Simple to set up with just historical data
- Fast to calculate in spreadsheets
- Reliable for stable demand
Cons
- Both lag when demand shifts suddenly
- Require ongoing parameter tuning
- Poor fit for volatile or intermittent demand
2. Holt-Winters for trend and seasonality
Holt-Winters is well-suited for products with clear seasonality or long-term growth. It builds on exponential smoothing by adding separate components for level, trend, and seasonality, making it more flexible than simpler smoothing methods.
The model can handle both additive seasonality (where seasonal effects stay consistent over time) and multiplicative seasonality (where seasonal effects grow as demand increases).
This makes it effective across categories with steady seasonal swings as well as those where seasonality scales with demand.
Pros
- Captures trend and seasonal patterns directly
- More responsive to structured changes than moving averages
- Works well with retail cycles, holidays, or recurring peaks
Cons
- Requires more parameters and tuning than basic smoothing
- Less accurate for products with irregular or intermittent demand
3. ARIMA and SARIMA for complex patterns
ARIMA (AutoRegressive Integrated Moving Average) works well for products where demand is highly autocorrelated, meaning past values can reliably predict future ones.
It combines three elements: autoregression (using past values), differencing (to stabilize trends and achieve stationarity), and moving averages (accounting for past errors).
SARIMA extends ARIMA by adding seasonal components, making it effective when both autocorrelation and seasonality are present. While these models are more data-intensive, they excel at capturing complex and structured demand patterns.
Pros
- Handles trend, cycles, and seasonal effects in one framework
- Flexible for a wide range of time series behaviors
- Good fit for mature products with longer sales histories
Cons
- Parameter selection is complex and often requires testing
4. Forecasting intermittent demand with Croston and variants
Croston's method is tailored for SKUs with irregular demand, where many periods show zero sales. It separates demand size from demand intervals, then combines the two to create forecasts.
While effective, the original method is biased, often overestimating demand.
Variants like the Syntetos–Boylan Approximation (SBA) and Teunter–Syntetos–Babai (TSB) improve accuracy by correcting this bias and adjusting more realistically to long gaps between orders.
Pros
- Designed specifically for intermittent demand
- Reduces distortion caused by zero-demand periods
- Variants provide more accurate and stable forecasts
Cons
- Less effective for items with trend or seasonality
- Sensitive to parameter settings and limited history
5. AI and machine learning in inventory forecasting
Machine learning methods can uncover relationships that traditional models often miss. Techniques like gradient-boosted trees, random forests, and neural networks detect nonlinear patterns and interactions across SKUs.
Tools such as Facebook's Prophet structure forecasts around trend, seasonality, and holidays, making them especially practical for retail.
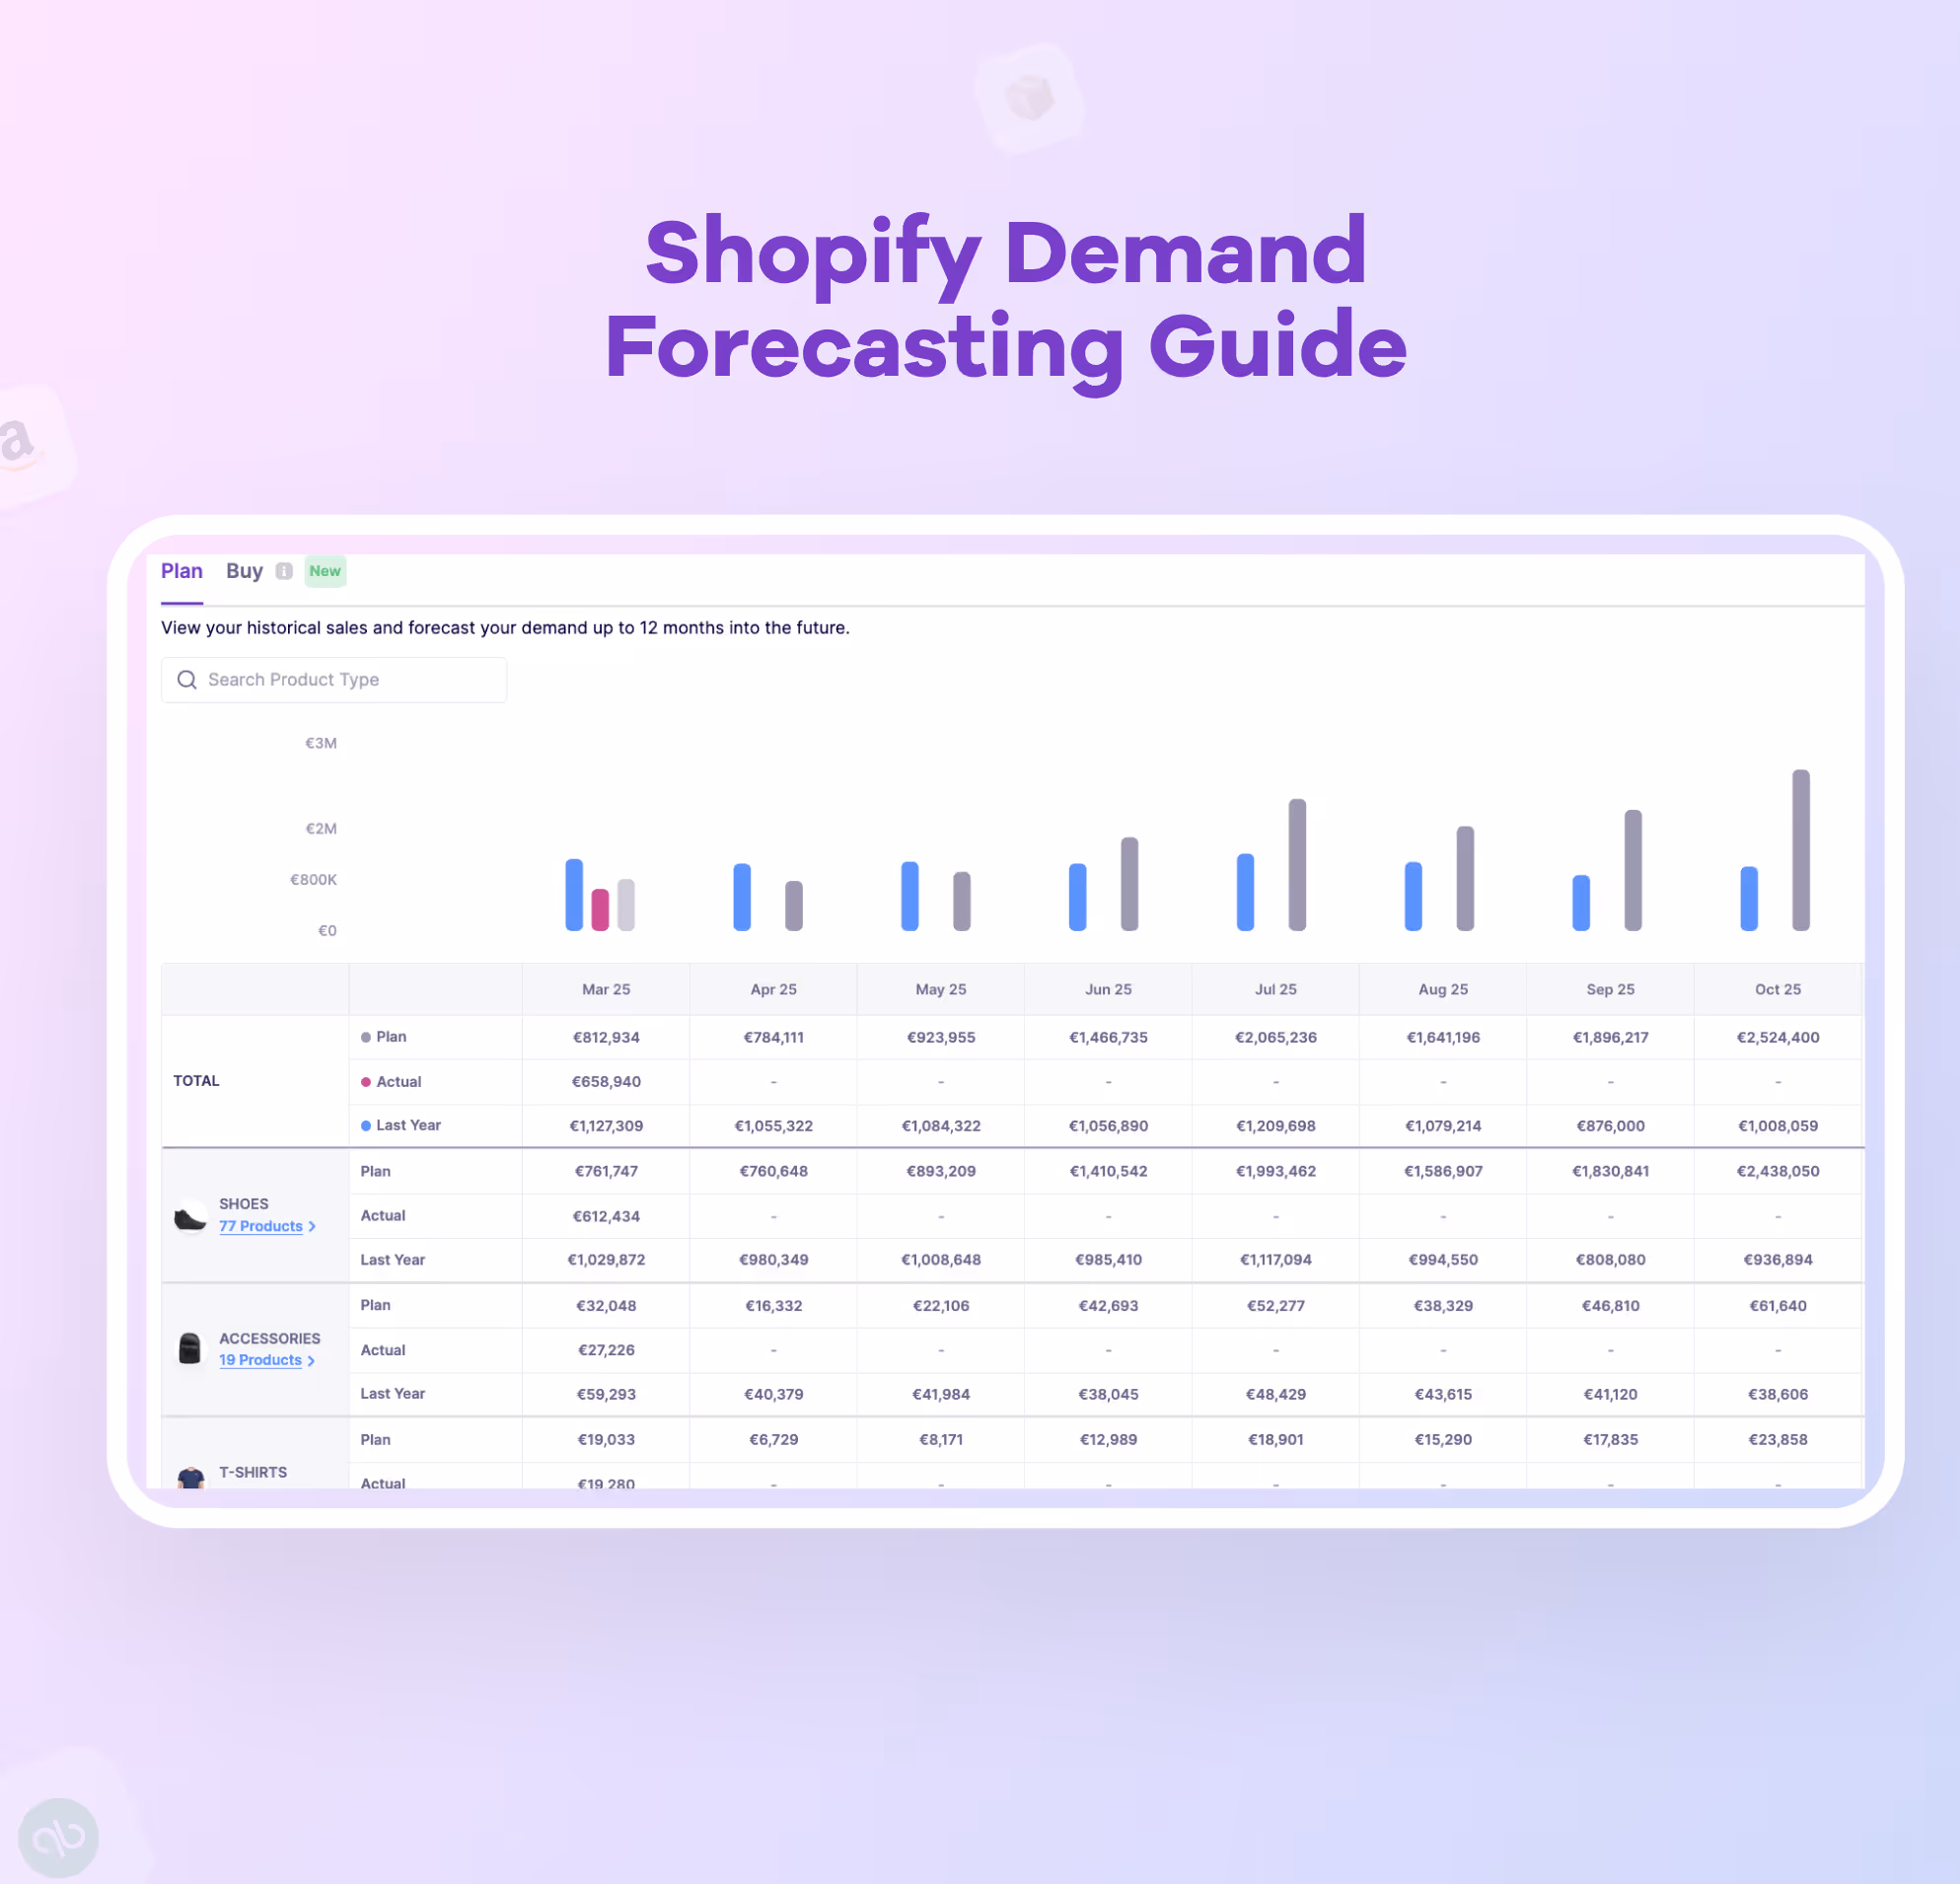
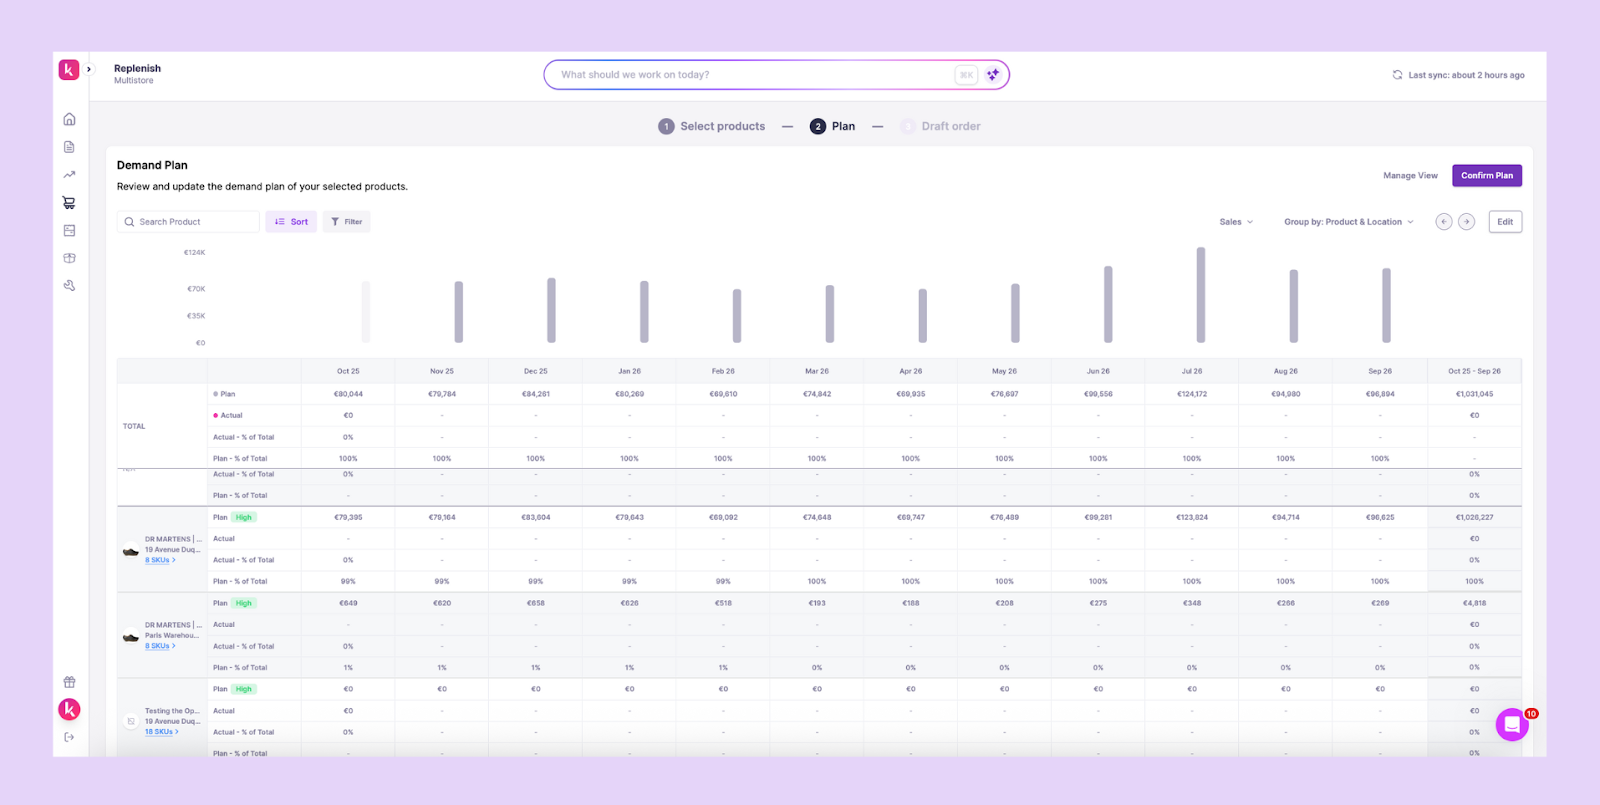
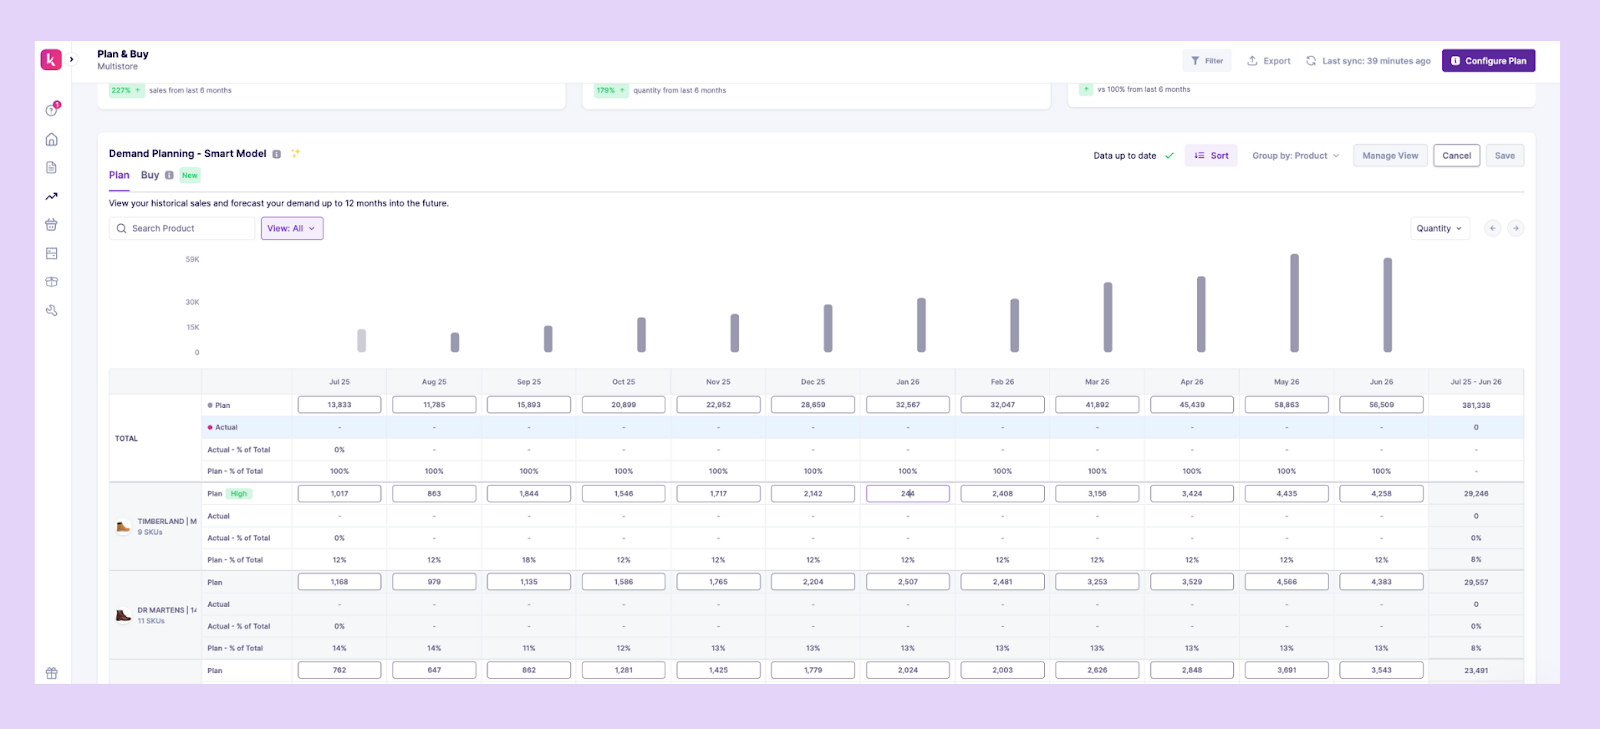
Prediko builds on these principles by blending classical forecasting with machine learning for Shopify brands. It integrates demand signals like promotions, seasonality, and growth trends to generate accurate SKU-level forecasts that adjust dynamically as conditions change.
Pros
- Handle complex, nonlinear demand drivers
- Can include external factors beyond sales history
- Adaptable to different product categories
- Can be handled with AI and automation easily
Cons
- Require larger datasets and more computation
Demand Sensing vs Traditional Inventory Forecasting
Traditional inventory forecasting relies on historical sales data to identify trends, seasonality, and recurring patterns. These methods are effective for medium to long horizons but often lag when market conditions change suddenly.
Demand sensing shortens the horizon by incorporating near-real-time signals such as recent orders, point-of-sale data, or even external factors like promotions and market shifts.
This makes it better suited for volatile SKUs, especially when demand changes quickly within days or weeks.
The most resilient planning process often combines both: demand sensing for short-term agility and traditional forecasting for medium-term stability.
| Aspect | Traditional Forecasting | Demand Sensing |
|---|---|---|
| Data Used | Historical sales, inventory, and purchase data | Near real-time signals (orders, POS, promotions) |
| Forecast Horizon | Medium to long term (months, quarters) | Short term (days, weeks) |
| Responsiveness to Volatility | Limited, lags during sudden shifts | High, adapts quickly to changes |
| Best Use Case | Stable SKUs, long-term planning | Volatile SKUs, immediate demand adjustments |
Evaluating Forecast Accuracy in Inventory Forecasting
Measuring accuracy is as important as selecting the right techniques for accurate inventory forecasting.
Here are the metrics that can help you evaluate accuracy in inventory forecasting.
1. WAPE (Weighted absolute percentage error)
WAPE shows forecasting error as a share of total sales. Unlike MAPE, which can exaggerate errors on low-selling items, WAPE balances things out by giving each SKU's error weight based on how much it actually sold.
For example, if a forecast is off by 10 units on a product that sells 1,000 units, the impact is small. But if it's off by 10 units on a product that only sells 15 units, MAPE would show this as a huge error.
Formula: WAPE = (Sum of |Forecast − Actual|) ÷ (Sum of Actual)
2. MASE (Mean absolute scaled error)
MASE shows how well a forecast performs compared to a basic "naïve" forecast (like assuming sales will be the same as last period). If the score is below 1, your model is doing better than that baseline.
Because it adjusts for scale, MASE is useful for comparing accuracy across SKUs with very different sales volumes.
Formula: MASE = (Mean absolute error of forecast) ÷ (Mean absolute error of naïve forecast)
3. Forecast bias
Bias measures whether a forecast consistently overpredicts or underpredicts demand. Even if the overall error is low, a biased model can still drive stockouts (from under-forecasting) or excess stock (from over-forecasting).
That's why bias is a critical metric for reliable operational planning.
Formula: Bias = (Sum of (Forecast − Actual)) ÷ (Sum of Actual)
Inventory Forecasting Best Practices
Even the best demand forecasting techniques in inventory management need the right framework. These practices make sure your forecasts don't just look accurate in theory, but actually work in day-to-day operations.
1. Always forecast for new products
New products rarely have enough sales history to run standard models, but leaving them unforecasted can quickly cause stockouts or over-ordering.
One way around new product demand forecasting is analogous product mapping. For example, if you launch a new sneaker, demand from a similar sneaker with the same audience, price point, and seasonality can guide your starting forecast.
Attribute-based models take this further by grouping products using features like category, price band, or material. A new skincare item, for instance, can inherit demand patterns from others in the same range.
Prediko makes this process seamless. It automatically uses sales data from similar SKUs in the same category to generate forecasts for new products, so you can launch with confidence and avoid costly inventory mistakes.
2. Do segmentation with ABC-XYZ Analysis
Segmentation makes forecasts more actionable by recognizing that not all SKUs deserve the same level of attention.
- ABC analysis groups products by their revenue contribution: A items drive the majority of sales, B items sit in the middle, and C items contribute the least.
- XYZ analysis measures demand variability, from stable (X) to highly unpredictable (Z)
When combined, the ABC-XYZ matrix shows where to apply different forecasting and inventory strategies.
For example, an AX item should have frequent forecast reviews and restocks. A CZ item, such as a niche accessory with irregular sales, may be better handled with made-to-order or some safety stock.
3. Governance with Forecast Value Added (FVA)
Forecast Value Added (FVA) measures whether each step in the forecasting process actually improves accuracy.
System forecasts, manual overrides, and consensus reviews can all be tested. If the error decreases after a step, it adds value; if the error increases, it adds a negative value.
For example, overrides on a promotional SKU may improve accuracy, while overrides on a stable, steady-selling item might make the forecast worse. In that case, the extra step should be removed.
The goal of FVA is to keep only the activities that enhance accuracy and eliminate those that don't.
How to Implement Inventory Forecasting Techniques for Shopify Brands
Turning theory into action: this section explains how Shopify brands can apply forecasting techniques to manage stock smarter and plan with confidence.
1. Segment SKUs by value and variability
Start by classifying SKUs based on ABC and XYZ analysis. Use ABC analysis to group products by revenue contribution and XYZ analysis to classify them by demand stability.
When you combine the two, it helps decide which SKUs need precise forecasts and which can be managed with simpler policies or buffers.
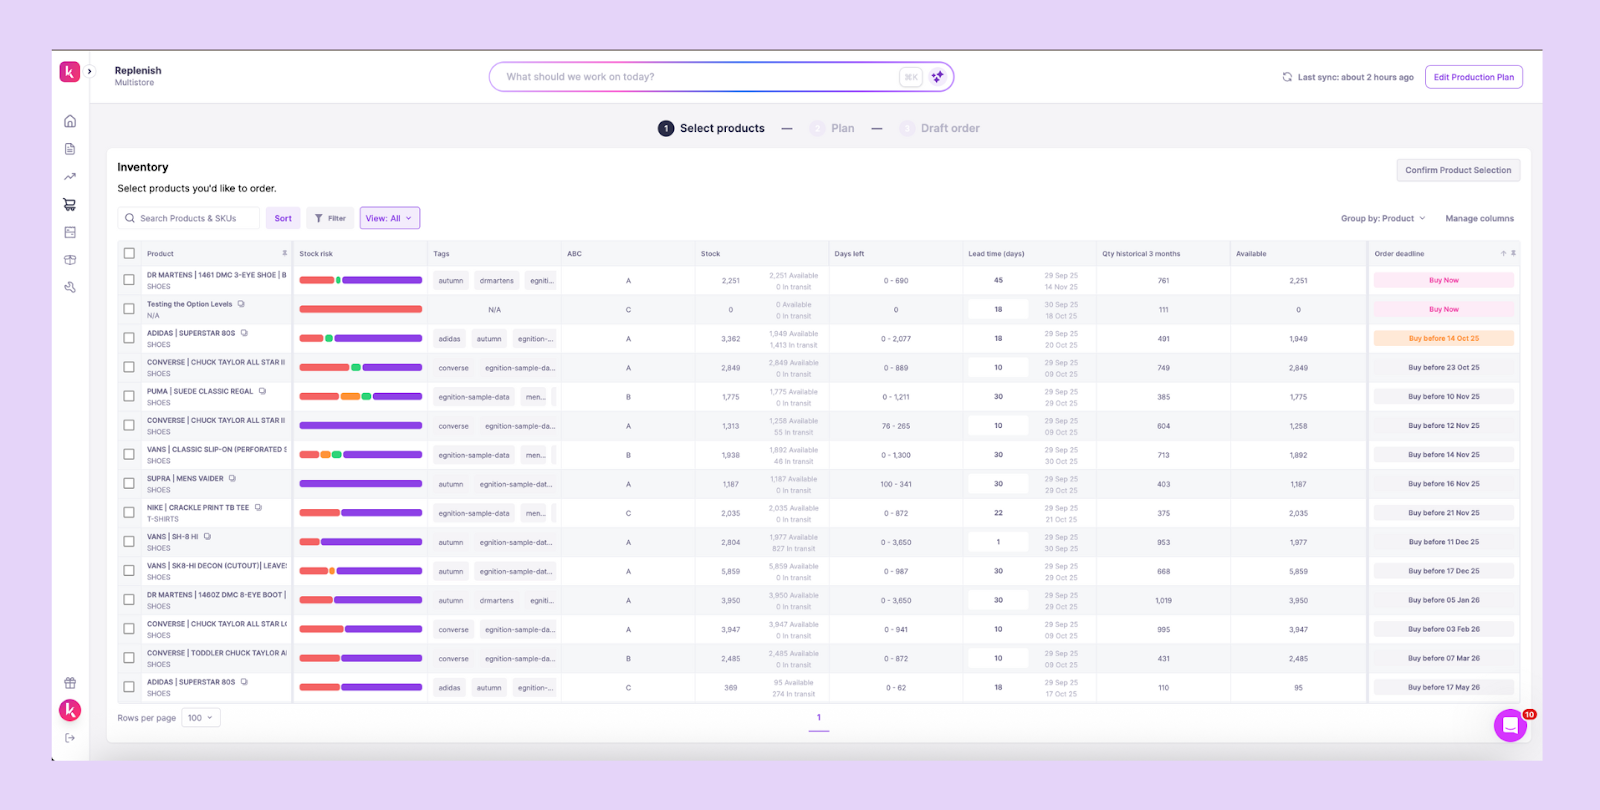
Prediko helps you automate ABC and XYZ analysis, so segmentation happens inside the platform without manual effort. Instead of spending team hours maintaining spreadsheets, you can get SKU-level forecasts and purchase suggestions.
2. Match forecasting methods to demand patterns
Different SKUs show different demand behaviors, so applying the same model everywhere rarely works.
The choice of technique should follow the demand pattern. Use moving averages or exponential smoothing for stable items, Holt-Winters or SARIMA for seasonal SKUs, and machine learning models for complex or promotion-driven demand.
Prediko makes this easier. Instead of testing methods manually and fine-tuning parameters, its AI applies the right forecasting technique in the background so forecasts stay accurate without extra effort.
3. Incorporate promotions, holidays, and product attributes
Don't just rely on historical sales. Factor in promotions, holidays, and product launches, and use product attributes like category or price band to forecast new items based on similar SKUs.
Adding these signals makes forecasts more realistic, especially for retail categories where external drivers play a large role.
Prediko factors in seasonality and holidays, like BFCM, from your past demand patterns, and also lets you edit the demand plan for upcoming promotions or ad campaigns
4. Test forecast reliability with rolling backtesting
Next, test the accuracy of your forecasts.
Forecasts that look accurate on one test period may fail under different conditions. That's why relying only on a single holdout (like comparing this year's forecast against last year's sales) can be misleading.
With rolling origin backtesting, you repeatedly shift the training and testing windows forward, for example, training in January–June to test July, then February–July to test August, and so on.
This approach reveals how well your model performs across multiple timeframes and demand situations, from steady months to promotional peaks.
5. Calculate safety stock based on service levels
Even the most accurate forecast cannot remove all uncertainty. Safety stock acts as a buffer against demand swings and supply delays, but the right level depends on both demand variability and the service level target you set.
A simple way to think about it
| SKU type | Demand profile | Safety stock approach |
|---|---|---|
| AX (high value, stable) | Predictable, low volatility | Lean buffer, but avoid tying up cash |
| BY (medium value, seasonal) | Moderate variability | Moderate buffer aligned with seasonality |
| CZ (low value, erratic) | Irregular, high volatility | Some buffer or even make-to-order |
6. Continuously track accuracy and bias
Now, measure performance with metrics like WAPE, MASE, and bias. WAPE keeps errors in perspective across SKUs of different scales, MASE benchmarks models against a naïve baseline, and bias reveals whether you consistently over- or under-forecast.
Monitoring these metrics ensures your forecasts align with business goals, not just statistical accuracy.
Take a skincare SKU that keeps selling below forecast. The bias reveals consistent overestimation, so without correction, you'll tie up cash in excess inventory. Spotting this early means you can adjust before it snowballs.
7. Use demand sensing for short-term agility
Remember to pair long-term forecasts with demand sensing.
Traditional forecasts rely on historical data, which works for medium- or long-term planning but often lags when demand changes suddenly. Demand sensing closes that gap by pulling in near-real-time signals.
These inputs help adjust forecasts quickly, especially for SKUs with volatile demand or short selling windows.
Prediko Makes Inventory Forecasting Simple and Accurate
Forecasting will never be perfect, but it doesn't have to mean constant firefighting. By classifying SKUs, applying the right inventory forecasting techniques, and adjusting for real-world signals, you can plan with more confidence and fewer surprises.
Prediko makes this easier by automating SKU segmentation, running AI-powered forecasts, setting safety stock, and even generating purchase orders across multiple locations.
Instead of wrestling with spreadsheets, you get forecasts and purchase plans that adapt in real time.
Start your 14-day free trial and see how Prediko makes inventory forecasting simpler, faster, and more accurate.
FAQs
1. What is the best inventory forecasting technique for seasonal SKUs?
For seasonal SKUs, techniques like Holt-Winters, exponential smoothing, and SARIMA capture seasonality and long-term trends. AI-powered models like Prediko take it further by automating seasonal forecasting, doing the heavy lifting for you.
2. How do I forecast SKUs with irregular or zero demand?
SKUs with long gaps between sales need a different approach. Croston's method is designed for intermittent demand, and its variants, like SBA and TSB, improve accuracy by correcting bias.
3. Which forecast accuracy metric should I use: MAPE, WAPE, or MASE?
MAPE is easy to understand but can be distorted by low-volume SKUs. WAPE gives a fairer view across different sales volumes, while MASE is best for comparing models against a simple baseline. Most brands use WAPE or MASE for reliability.