

Your best-selling product is about to go out of stock. You didn't see it early enough. The reorder would take at least two weeks. And now you're going to miss sales you could have easily kept—if you had caught it a week earlier.
One wrong number in a spreadsheet, one late update, and you're off.
You can't plan demand by looking backwards. You need to know what's happening now and what's likely to happen next.
That's where analytics come in.
This article breaks down how to use analytics in demand planning, the models teams actually rely on, and how to start building a setup that helps you act before things go wrong.
Understanding Analytics in Demand Planning
Analytics in demand planning involves using historical data, AI algorithms, statistical models, and real-time insights to make smarter, faster, and more accurate decisions about what to produce, stock, and sell.
While it includes patterns from past sales, it also integrates external variables such as promotions, weather, macroeconomic indicators, and channel behavior.
The goal is to quantify uncertainty and narrow the range of outcomes planners need to prepare for.
The traditional approach relied heavily on manual forecasts and past-year comparisons.
Adjustments came after gaps were already visible, like stockouts, excess inventory, or late supplier responses. That's reactive planning.
With analytics, you make planning a forward-looking process. You can predict outcomes before they happen, set thresholds for reordering, and define triggers based on probability, not instincts, helping you respond to early signals, not aftershocks.
Key Analytical Methods for Demand Planning
Analytics aren't universal. What drives performance in one industry might be irrelevant in another. The choice of analytical method depends on demand stability, rate of change, and data availability. Here are some of the different methods
1. Predictive Analytics
Predictive analytics is the foundation of many demand planning software. It uses historical data to create a data-backed picture of future demand.
This includes weekly or monthly sales, seasonality, known events like promotions or holidays, and long-term trends. To be precise, it works with known patterns.
Core components include
- Time-series models (ARIMA, exponential smoothing)
- Explanatory variables (e.g., promotions, price shifts)
- Clean historical data, typically 2 to 3 years minimum
This method builds forecasts at a granular level, such as individual SKUs and store locations, and also combines them to get a broader view across regions or sales channels.
For example, a beverage company might use this method to predict summer demand for soft drinks in coastal cities.
With consistent seasonal patterns and strong sales history, the forecast is likely to be reliable.
Predictive analytics in demand planning is most effective when
- Products have stable, repeating demand
- Historical data reflects normal operating conditions
- Forecasts need to be backed by data
It's not built for high-volatility environments, but that's not a flaw; it's intentional. Predictive analytics gives Shopify stores control, transparency, and consistency. For base demand forecasting, that's exactly what matters.
2. Machine Learning Models
Machine learning models are built to handle complexity that static statistical models can't manage. They don't rely on predefined assumptions about seasonality or trend.
Instead, they learn directly from the data and continue to adjust as new information comes in.
Key elements include
- Large, diverse datasets (sales, inventory turnover, growth trends, returns)
- Algorithms like random forests, gradient boosting, and neural networks
- Continuous retraining to adapt to behavior shifts
This method is especially useful when demand is influenced by many fast-changing factors.
Imagine a sneaker brand launching a new color of a popular shoe. Machine learning models analyze patterns like how other colors sold during the past year or in specific regions, to predict demand for a product with no prior sales data.
These models capture patterns that traditional forecasting misses, like how certain sizes or colors sell faster in specific stores or seasons. They connect these relationships between inventory and sales, even when demand shifts quickly.
Its use cases include
- B2C e-commerce, where user behavior changes almost every day
- New product introductions with no sales history
- Promotion-heavy categories
3. Real-Time Data Analysis
Real-time data analysis is about reacting within weeks or months, not quarters or years. When demand spikes, you're making quick decisions to cover for the immediate future, like the next couple of months, based on what's happening right now. This is a core principle of Inventory Forecasting For Consumer Goods, where speed and accuracy matter more than long-range projections
Here's what you need to keep track of
- Live sales transactions across channels, including POS
- Current inventory and logistics status
- Reports or alerts for fast adjustments, typically weekly or monthly
Let's say you're a fashion retailer and you notice your "low-rise cargo jeans" go viral on TikTok after a creator with 1M+ followers posts a styling video.
Within a day or two, your sales may spike and your real-time data dashboard will flag it, triggering you to reorder to fulfill the upcoming demand without waiting for long-term forecasts.
It's especially useful for
- Fashion and apparel businesses, where trends can shift rapidly
- Managing fast-moving consumer goods with short shelf lives
- Responding to short-term events like local promotions or viral spikes
This setup depends on tight integration across ERP, POS, WMS, and sometimes external inputs like social listening or regional data. If your systems don't sync properly, response time suffers, and decisions get delayed.
Prediko combines advanced machine learning models with real-time data analysis. It's AI, trained on 25 million SKUs across 15+ industries, processes high volumes of SKU-level data across regions and stores.
It factors in variables like lead times, safety stock, and sales velocity. It then sends smart replenishment alerts based on real-time demand signals, helping D2C brands stay ahead of sudden demand shifts and plan with confidence.
For fashion brands looking to forecast better, here's a guide on using analytics in fashion forecasting.
Benefits of Integrating Analytics in Demand Planning
Integrating analytics into your demand planning process gives you the clarity, accuracy, and agility needed to make smarter inventory decisions. Here's how it all comes together.
1. Higher accuracy
Bad data doesn't just mess up your spreadsheet. It messes up your shelf, your timing, and your delivery promises.
Retailers lose over $1.72 Billion a year from out-of-stocks and overstocks, according to IHL Group's report on supply chain breakdowns.
That's a warehouse worth of stuff in the wrong place at the wrong time.
Sometimes it's a store that runs out of your top seller. Sometimes it's a warehouse full of seasonal stock that never leaves. Either way, it's expensive.
Analytics helps clean that up. When demand planning is tied to real-time data, sales, supplier lead times, and even growth trends, you're not guessing. You're reacting faster and forecasting with fewer instincts.
2. Reduced inventory waste
Over-ordered SKUs, expired products, and seasonal stock that missed its window are common sources of inventory waste across stores, warehouses, and vendors.
In the fashion industry alone, about 92 million tons of textile waste is generated each year because of overproduction and unsold stock.
And it's not just clothes. Grocery, pharma, electronics, every industry is guilty of stock that ages badly on the shelf or never leaves the warehouse.
A big reason? Buying more than what actually sells.
Analytics helps change that. You're not just looking at what sold last quarter, you're accounting for regional sales patterns, product lifecycle, and real sell-through rates. Some brands even account for return probabilities before placing reorders.
3. Improved service levels and fulfillment performance
Orders don't just need to ship fast. They need to ship right.
Analytics shows teams where supply or demand issues are originating from, like supplier delays, sudden demand spikes leading to shortages, or inefficient allocation across warehouses.
When these issues are spotted and addresses, it results in
- Fewer stockouts for customers
- Better pick-pack accuracy for ops
- Higher OTIF rates (orders delivered when promised and in the correct quantity)
Walmart, for example, saw its on-time delivery performance jump when it started holding suppliers to stricter delivery windows and measuring fill rates (the percentage of customer demand met without delay) more tightly
To reach this level of control, you need real-time visibility across suppliers, carriers, and locations, and not just spreadsheets. Accurate data leads to fewer fulfillment surprises. And that means less chaos at the last mile.
4. Faster course corrections
Forecasts go off track. That part's guaranteed. What matters is how fast you catch it.
When analytics is baked into your demand planning, teams aren't waiting for end-of-month reports. You can catch a sudden spike in returns, a drop in regional sales, or a product that stops selling while it's happening.
These early signals give you breathing room. Time to shift inventory, reroute shipments, adjust purchase orders, whatever it takes. Every issue you catch early is costs saved.
Implementing Analytics in Your Demand Planning Process
Shopify gives you some reporting, but it's more of a rearview mirror than a radar. You'll see sales by product, inventory turnover, maybe a few custom reports if you're on a higher plan, but that's where it stops.
No demand forecasting. No granularity in data analysis. No restock alerts.
For that, you need a tool like Prediko that is actually built for demand planning. It connects directly to Shopify, pulls all your sales and inventory data, and gives the forward-looking picture you need to avoid stockouts and overstocking.
Here's a step-by-step process of how to add analytics to your demand planning process
Step 1: Audit your current Shopify reporting setup
Go into your Shopify admin and look at what you're currently tracking
- Top-selling SKUs
- Daily/weekly/monthly sales
- Current inventory levels
- Sell-through rate
Now ask
- Can you forecast demand next month based on what's here?
- Do you know when to reorder each SKU?
- Can you factor in lead times or supplier delays?
If the answer's no (or maybe), that's your starting point. You're not doing anything wrong. Shopify is great for selling, but it's simply not built for forecasting.
2. Connect a demand planning tool like Prediko
Prediko integrates directly with your Shopify store. Once it's connected, it automatically pulls
- Sales history (by SKU, Store, Category)
- Inventory levels across warehouses or locations
Then it gives you analytics such as
- Forecast by product and category
- Reorder suggestions considering safety stock and lead times
- Visibility into how much inventory you'll have left by week or month
This is the part Shopify skips entirely. Using a tool like Prediko, you see what you sold, what's coming, what you're likely to sell next, and what stock you'll need to keep up.
3. Train your team on reading and acting on data
You can't drop a new tool into the mix and assume everyone will just "get it." Analytics and data are only useful if your team understands what to do with them.
Here's what team training should cover
- How forecasting accuracy shifts when tracking sales patterns and external factors
- How to calculate stock coverage with lead times and safety stock to feed into the system
- What to do when supplier MOQs (minimum order quantities) conflict with demand signals
- How buffer stock may vary by product type and seasonality
Run scenario training using recent sales and inventory data. Break down gaps between forecasts and actual outcomes, identify root causes like supplier delays or sudden demand spikes, and show your team how to adjust planning assumptions.
This sharpens data literacy where it counts, on real business decisions.
4. Set up a forecast feedback loop
One of the easiest ways to catch a problem early? Just compare what you thought would sell with what actually did.
Sounds basic, but hardly anyone does it properly.
Let's say you planned for 500 units of a new collection. Week one, 200 fly off the shelf. Week two, it stalls. No one checks why. The next order still gets placed, based on the original forecast. Inventory piles up.
Now, imagine if someone paused after week one. Looked at the dip. Noticed the drop-off came after the Instagram campaign ended. Adjusted the next order to 100 units instead of 300.
That's the feedback loop.
Not a dashboard. Not a KPI meeting. Just noticing, asking why, and tweaking the next move. It's small, but over time, that's what separates reactive businesses from ones that stay lean.
If you're using Prediko, you don't need someone to track these sales numbers and identify patterns. Its AI can read the patterns behind sales and catch subtle changes, like a dip in sales after holidays that traditional tools might miss.
By continuously learning from these signals, Prediko updates future forecasts automatically. This means your next reorder or production plan already accounts for shifts in demand, keeping your planning flexible and inventory aligned with what's actually happening.
Challenges in Integrating Analytics in Demand Planning
It's easy to say "just use data", harder when the data's a mess, the team's not on board, and every tool claims to be the solution.
Let's talk about the things that slow businesses down in the process.
1. Data cleanliness and compatibility
If your product tags are inconsistent, SKUs are duplicated, or sales data is sitting across five tools that are not connected, analytics won't clean that up.
Before anything gets integrated, your data needs to be
- Consistent (same naming conventions across systems)
- Complete (no gaps in sales or inventory records)
- Connected (tools like Shopify, WMS, and 3PLs should feed into the same place)
Without the right data flowing in, any forecast can go wrong, no matter how advanced the tool.
Prediko integrates with over 60 apps, pulling in real-time data from sales channels, WMS, and 3PLs automatically. That way, forecasts are always based on accurate, current inputs, not outdated or incomplete information.
2. Internal resistance to change
This challenge is not technical but a cultural one.
Forecasting by instinct has been the default for years. Some teams don't want dashboards telling them what to order. Others are overwhelmed by anything more complex than a spreadsheet.
Don't assume everyone's excited to "get analytical." You need buy-in. That happens when
- People are shown how analytics makes their job easier (if you're considering Prediko, here's an impact calculator to estimate the ROI after implementing)
- The first few wins are small but clear (e.g., avoiding one stockout, reducing POs of an underperforming SKU)
- Training is non-technical and role-specific
Prediko is built for ease of use. Whether your team is switching from spreadsheets or enterprise tools, the platform is intuitive enough that anyone on your team can start making data-backed inventory decisions from day one.
3. Choosing the right tools and metrics
Many tools are not built for today's dynamic retail setups. Businesses often end up paying for data they don't need, or worse, only get access to basic, surface-level reports.
Prediko Analytics and Reports, on the other hand, offer deep, actionable insights for your inventory operations.
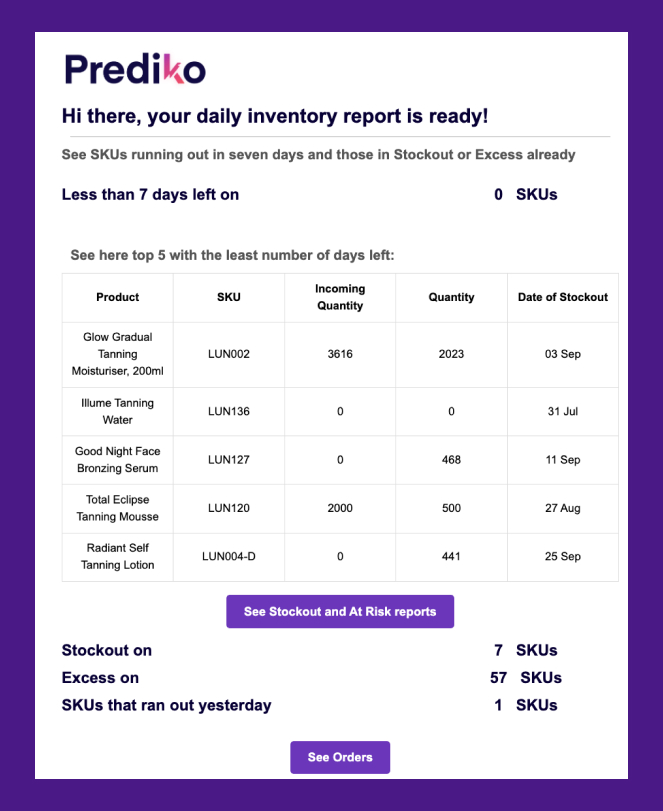
It plugs directly into your Shopify store and doesn't just show you what sold, it gives you weekly & daily reports on performance, stockouts, what's running low, what's in excess, cost of inventory you're holding, and how close you are to hitting your inventory target.
Here's a closer look at what you get
.png)
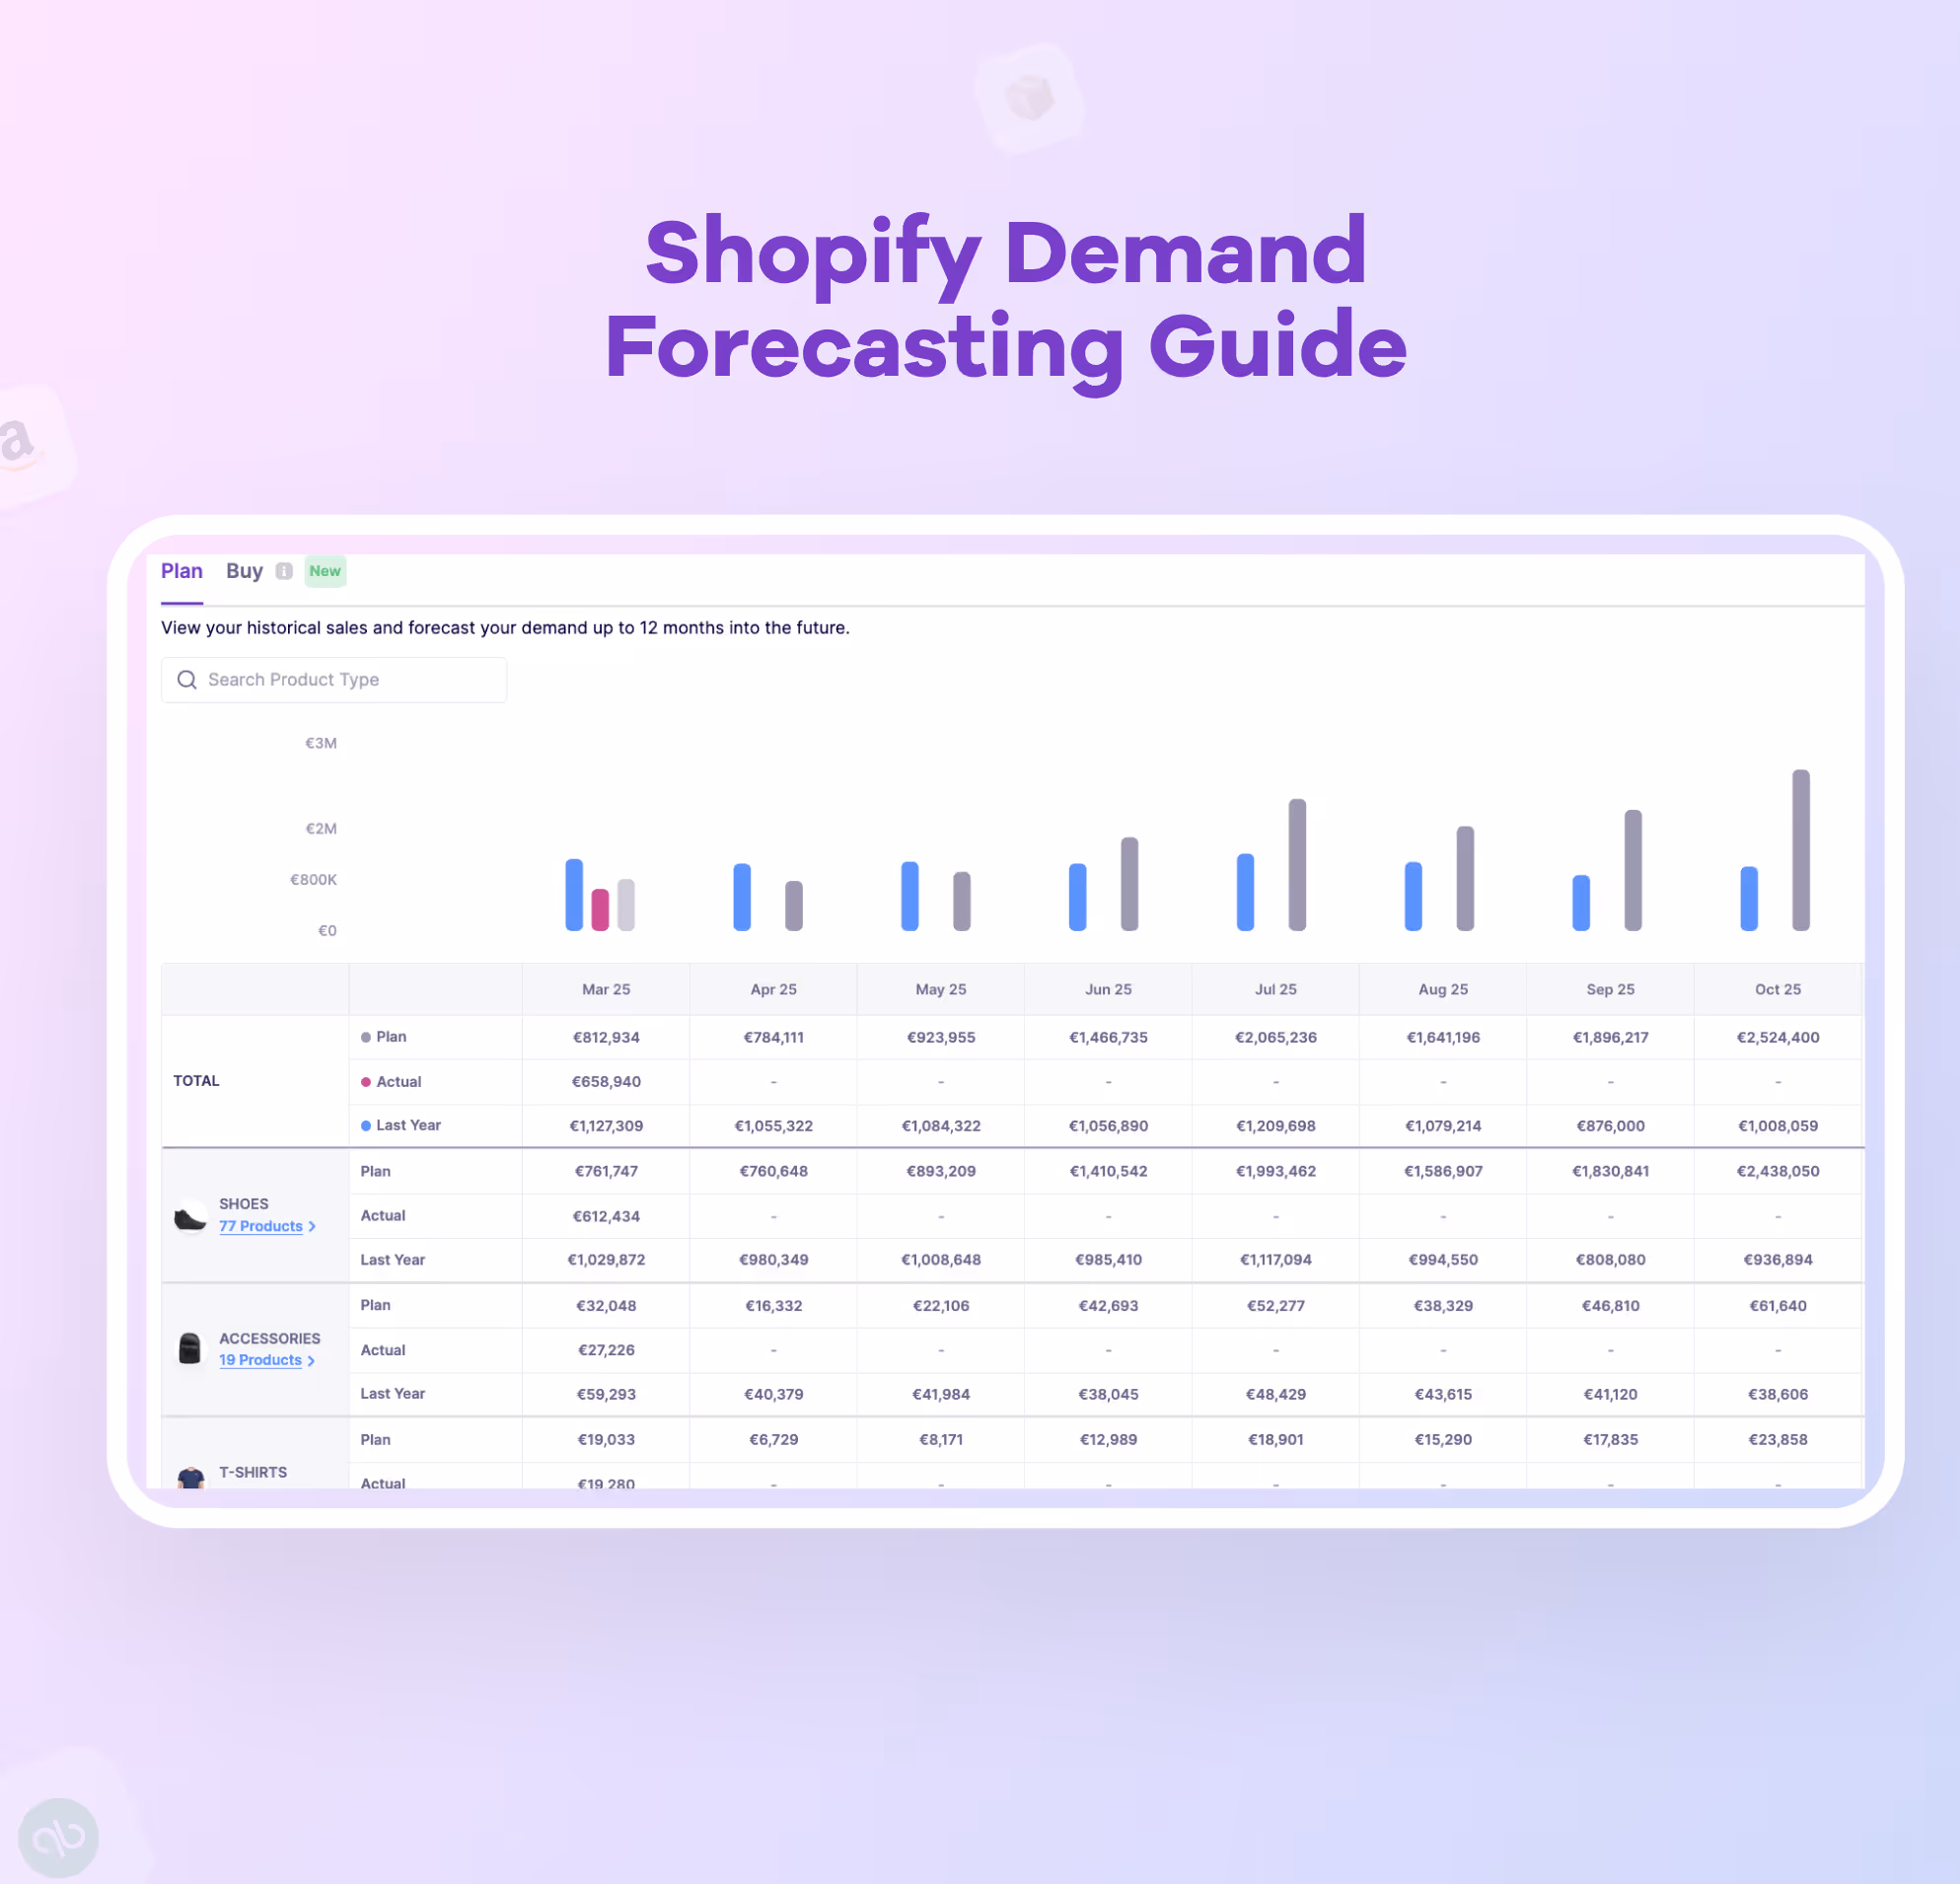
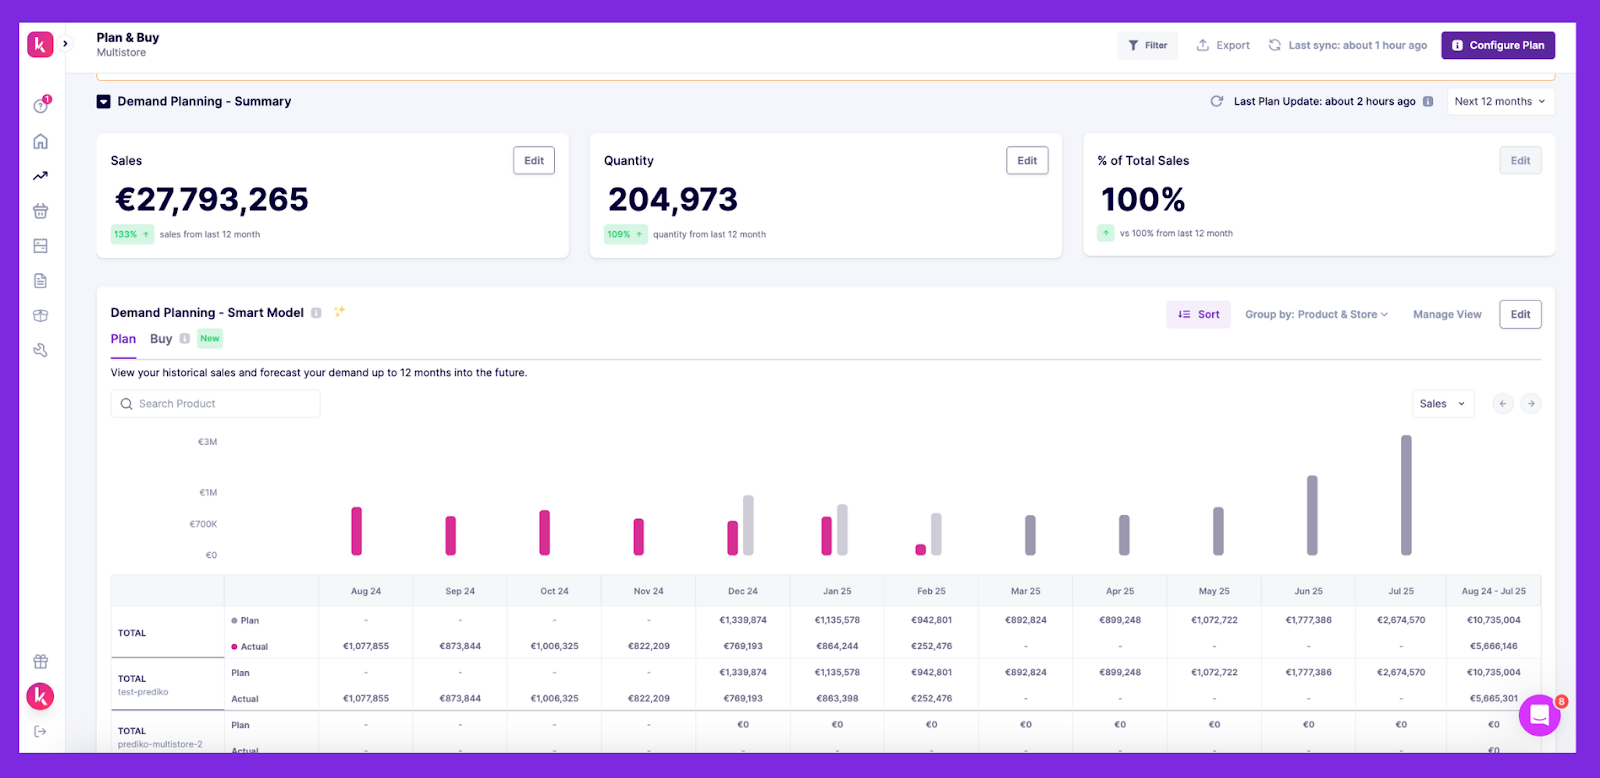
- AI demand planning that forecasts demand by analyzing historical sales, seasonality, and growth. It breaks down your revenue target across 12 months and allocates stock needs by product, SKU, and product type.
- Daily & weekly inventory reports that go beyond "here's your sales." You get alerts like 88% of plans achieved, SKUs in most stockouts, Late POs, excess stock, or top sellers in the last 7 days.
- Automated "Buy Now" nudges that tell you exactly how many units to reorder of which SKU and when, based on lead time, days of cover, forecast, and safety stock (like, "Buy 50 now to avoid running out by Nov 10")
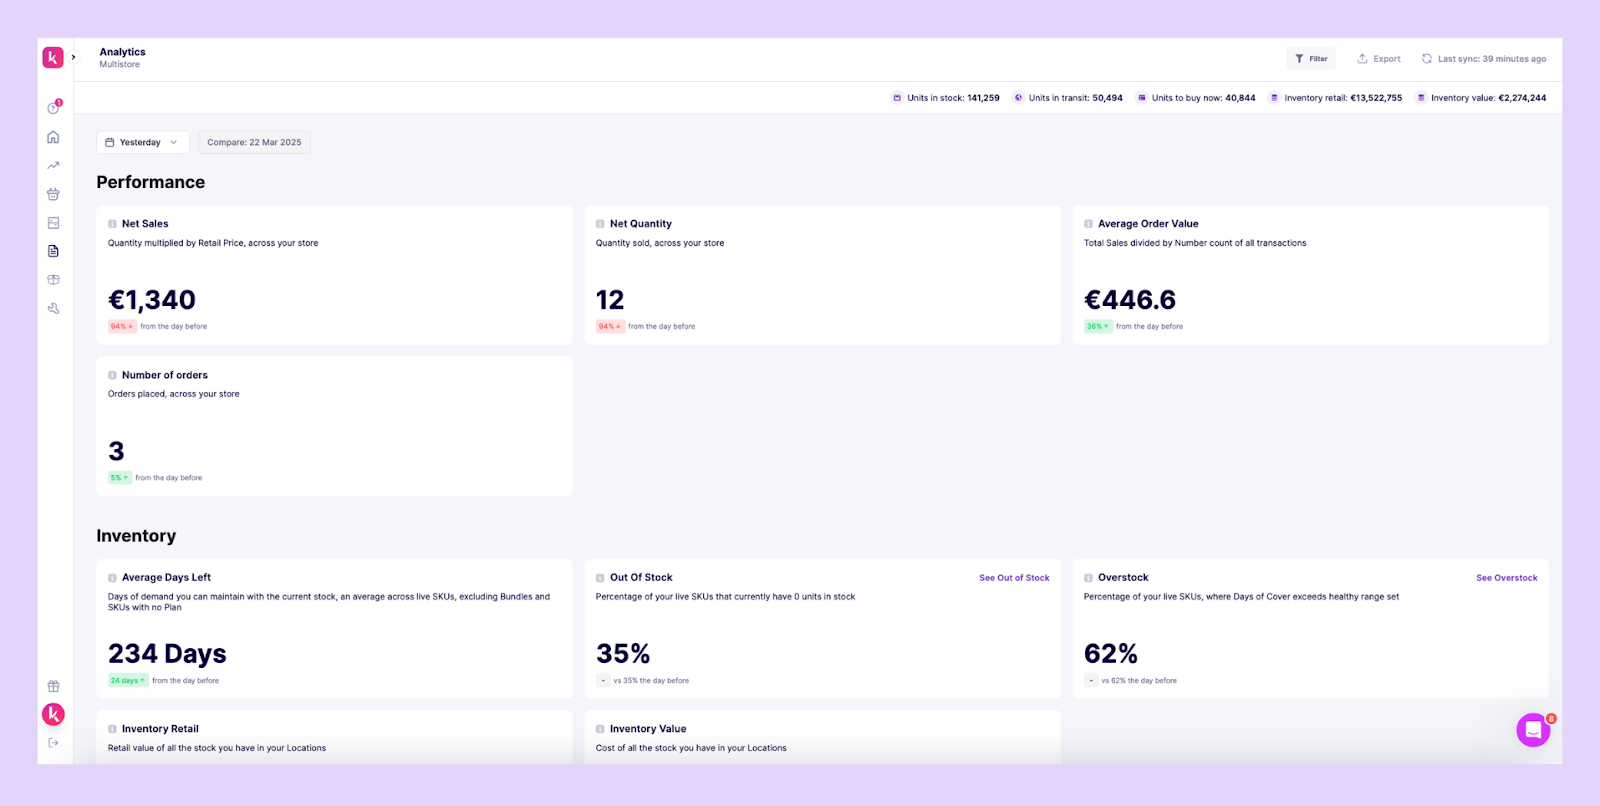
- Real-time visibility into how much inventory is tied up, where you're at risk of going out of stock, and what's not moving or is in excess
- 100+ filters to customize views by SKU, supplier, product type, or store location
- Daily or weekly email alerts with links that take you straight to problem SKUs (stockout, at risk, aging inventory)
What makes Prediko useful isn't just the visual and easy-to-consume data. It's also the way it turns raw inventory data into clear, time-sensitive decisions.
The software is designed around how Shopify stores actually work. Quick data pulls, product-level filters, and alerts that show up in your inbox before the issue becomes expensive.
Switch to Smarter Apps for Smarter Demand Planning
By now, it must be clear that if you're relying only on Shopify's default reports, you're planning with half the picture.
Apps like Prediko give you the missing half. You can forecast demand, see how your inventory is performing week to week, which SKUs are running low or sitting too long, and how far off you are from your sales plan.
It also helps you figure out how much to reorder and when to do it, without switching between tools or spreadsheets.
Want to take the automated and cost-saving route to integrating analytics in demand planning? Sign up for Prediko's FREE 14-day trial.