If your products are constantly out of stock or overstocked, there’s a good chance something’s missing in your inventory forecasting approach. Over time, this can cost you your hard-earned revenue in the form of frustrated customers, tied-up cash, wasted space, and a hit to your reputation.
The challenge only grows when you’re managing multiple channels, running promotions, and accounting for other external factors impacting your decisions. So how do you take control of your inventory? Which metrics should you be tracking? And what are the most reliable forecasting methods?
We’ll answer all these questions and more in this complete guide to inventory forecasting (no matter your sales channel).
What is Shopify Inventory Forecasting?
Inventory forecasting is the process of predicting how much stock you will need to fulfill customer demand over a specific period. The predictions are based on historical data, market trends, and seasonal fluctuations.
The goal here is to have the right amount of inventory at the right time in the right place (if you manage multiple sales channels).
Think of it like planning a road trip; you need to know your destination, the best route to get there, an estimate of how much petrol you'll need, and anticipate potential detours and road closures.
Inventory forecasting answers questions like
- How much stock should we order to avoid stock outs?
- When should we place the next purchase order?
- What products will sell the most and the least?
Excel for inventory forecasting
New entrants and small eCommerce stores often start with the most obvious tool for data analysis —Excel. While Excel can work well initially for inventory forecasting, offering basic formulas for demand calculations, it quickly falls short as businesses grow.
As businesses grow and product lines expand, manually updating spreadsheets becomes an impossible task. What worked for tracking 50 products gets unmanageable when dealing with 500 or 5,000 SKUs. Demand prediction formulas become intricate and hard to maintain, and Excel only provides static inventory data.
It can't integrate real-time data from sales channels or supplier orders, so you'll often be working with outdated information. Dedicated inventory forecasting tools like Prediko offer features beyond what Excel can provide.
Using machine learning algorithms and statistical analysis, these tools give precise demand predictions, integrate data across channels, and offer a real-time 360-degree view of inventory and supply chain. You can also automate parts of inventory management, like purchase order creation, reporting, and reordering, to keep pace with business growth.
For businesses considering move from Excel to dedicated inventory forecasting software, the decision often becomes clear when they see the true cost of manual inventory management.
The time spent on spreadsheets, potential losses from inaccurate forecasts, and missed opportunities for strategic planning all signal the need for a more advanced solution. Using such a tool can help you.
1. Reduce stockouts and overstocks
Most businesses constantly swing between having too much or too little stock. Stockouts can cost you missed sales, frustrate customers, and may even drive them to competitors.
On the flip side, overstocks mean your cash is tied up in unsold goods, impacting cash flow and limiting flexibility for new stock. When you know how much stock you’ll need, you can maintain the right balance that supports steady cash flow and prevents stockouts and excess inventory.
Shopify Inventory Alerts: Low Stock, Out of Stock, and Back in Stock Notifications for Better Management
2. Lower costs
When your inventory is in balance, you can cut costs across operations. Storage costs decrease because you're not holding the "just in case” inventory. Emergency orders and rush shipping fees become rare since you can spot potential stockouts weeks in advance.
You can negotiate better prices with suppliers by placing orders on a predictable schedule rather than last-minute panic buying.
Plus, you’re able to avoid excessive carrying costs, such as warehousing fees and the expenses of managing and insuring surplus stock, leaving you more budget for other business areas.
3. Plan promotions strategically
By understanding which products are likely to be in demand during specific times, such as holidays or seasonal changes, you can plan your promotions and stock accordingly.
Companies can create targeted marketing campaigns that align with inventory levels, like offering discounts to clear out slow-moving items.
Analyzing frequently bought-together items also helps you create bundles effectively. Most importantly, you can stock sufficient products based on predicted demand before announcing any event or campaign, preventing customer disappointment and lost sales.
4. Satisfy and delight more customers
Inventory forecasting allows you to consistently meet customer demand without frustrating delays or “out-of-stock” messages. Customers who can rely on you for product availability are far more likely to return and recommend you to others.
Whether it's maintaining stock for a popular item or having enough inventory for a seasonal surge, when you create a seamless shopping experience you’re able to build loyalty and brand reputation.
5. Take data-driven decisions
With reliable forecasts, you can confidently make decisions that go beyond purchasing. This includes choices like expanding into a new product line, planning for new locations, allocating your marketing budget, negotiating with suppliers, and creating product bundles.
Accurate forecasting also improves financial planning because of predictable cash flow and expenses. This way, forecasts help every department make faster, more informed decisions.
If you follow all these steps, it's easy to do accurate demand forecasting
Whether you’re forecasting manually or with the help of software, some important metrics need to be tracked for accurate predictions.
1. Safety stock
Safety stock acts as a buffer against unexpected spikes in customer demand or supply delays. This amount of stock ensures you don’t run out of stock when things don’t go as planned.
How to calculate safety stock
Safety Stock = (Maximum daily sales x Maximum lead time) – (Average daily sales x Average lead time)
2. Reorder points
The reorder point tells you when to restock a product so that you have enough time to receive new stock before running out.
To be precise, it’s the inventory level at which you need to place an order with your supplier to fulfill orders without interruption.
How to calculate reorder points
Reorder Point = (Average sales per day × Lead time (in days)) + Safety stock
3. Lead time
Lead time is the duration between placing an order with a supplier and receiving the stock. Knowing this is essential for setting accurate reorder points. Lead time can vary by supplier.
How to calculate lead time
Lead Time = Date of stock receipt - Date of order placement
4. Economic order quantity (EOQ)
EOQ is the ideal quantity that must be ordered to minimize inventory holding and ordering costs, striking a balance between the two.
How to calculate EOQ
EOQ = √((2 × Demand (in units) × Order cost per purchase order))/ Holding cost (per unit)
5. Inventory turnover ratio
This ratio measures how many times your inventory is sold and replaced over a specific period, helping you assess the efficiency of your stock.
How to calculate the inventory turnover ratio
Inventory Turnover Ratio = Cost of goods sold (COGS) / Average inventory
6. Sell-through rate
The sell-through rate shows the percentage of inventory sold during a period relative to the amount you received. It helps understand the product demand and is especially useful for seasonal items.
How to calculate the sell-through rate
Sell-Through Rate = (Units sold / Units received) × 100
7. Rate of returns
The rate of returns tells you how often products are returned, indicating potential issues with quality or customer satisfaction.
How to calculate the rate of returns
Rate of Returns = (Units returned / Units sold) × 100
There are various inventory forecasting methods that businesses can use to predict future demand precisely. Each method has its unique approach and is suited for different scenarios.
1. Trend
Trend forecasting looks at historical sales patterns to identify general growth, decline, or stability in demand over time. For instance, your running shoes have shown a steady increase in sales each quarter, trend forecasting will project this pattern into the future, helping you anticipate rising demand.
Now, you don’t have to stop here. You must look at why this trend exists. Perhaps there's a growing running community in your area, or your marketing has been particularly effective. You also need to spot when trends might break by looking at any external changes to avoid inaccurate forecasts.
Trend forecasting is beneficial for established products with consistent sales data, as it relies on historical performance to predict future demand.
2. Quantitative
Quantitative forecasting relies heavily on hard numbers and mathematical models. In practice, it works best when you have at least two years of solid sales data.
The more comprehensive the dataset, the more reliable the forecasts will be.
Say, you're managing inventory for an apparel store. You gather data points like daily sales by category, seasonal trends, and the impact of promotions throughout the year. Your average daily sales are 200 t-shirts, but you see a 25% increase during holiday promotions and a 15% decrease in winters.
Now, you can calculate your future inventory using a formula like Base Demand (200) x Promotion Factor (1.25) x Seasonal Factor (0.85). This helps you predict that you'll need a daily inventory of about 235 t-shirts during a summer holiday sale.
Modern inventory management solutions like Prediko, built for Shopify brands can handle these calculations automatically.
3. Qualitative
Qualitative forecasting uses expert judgment, market research, and customer feedback to predict future demand. While it might seem less scientific, it's important for responding to market dynamics that numbers alone can't predict.
This method is useful when historical data is limited or unavailable, such as when launching a new product or entering a new market.
For example, a tech company launching a new gadget with no prior sales history could gather input from beta groups, surveys, and industry experts to estimate demand. Although this is more subjective, it helps the company make an informed forecast when data is limited.
4. Graphical
Visual analysis of data often reveals patterns that numbers alone might miss. Graphs and charts (such as line graphs, pie charts, or bar charts) can make it easier to interpret sales data, especially to spot irregularities, seasonal trends, and long-term shifts at a glance. You can make adjustments to your inventory forecasts based on visual cues from the data.
Most successful businesses actually combine all these methods for the most accurate forecasting.
While analyzing historical sales data is important, several other factors also have a unique impact on inventory forecasts.
1. Seasonal trends
Seasonal shifts can cause drastic demand fluctuations. For example, if you sell apparel, you’ll likely need to stock more coats and jackets in the winter and lighter clothing in the summer.
Other seasonal spikes, like holiday shopping around Black Friday or Christmas, can also multiply demand, so factoring in these periods is important to avoid empty shelves or, conversely, excess stock that sits idle during off-peak seasons.
Remember, you need to look both backward and forward as you can't simply look at last year's numbers and repeat them. The market changes, your business grows or contracts, and buyer preferences change.
Prediko automatically factors in your seasonal and growth trends, distributing your sales goal across each month of the year.
2. Promotions and campaigns
Promotions often lead to sudden, short-term demand surges. A single flash sale can wipe out three months of inventory in just a few days if you haven't prepared properly.
If you know a promotion is coming up, adjust your forecast already to include higher quantities for the promoted SKUs and ensure you have enough buffer stock to satisfy the spike. This way, you avoid losing out on potential sales and prevent frustrating customers with “out-of-stock” notices.
3. Multiple channels
Businesses often sell through different platforms like Amazon, Shopify, and brick-and-mortar stores. Each channel may have different demand patterns and customer behaviors that need to be considered in forecasting.
For example, a product may sell well on Amazon during Prime Day but not see the same traction in physical stores. You need to see data from all channels to adjust your inventory forecasts and allocate accurate inventory.
Pro tip: Keep higher buffer stock for marketplaces like Amazon and Lazada because running out of stock on such platforms can result in severe penalties and lost rankings.
Prediko consolidates all your sales and inventory data in one place, whether you're managing multiple stores, warehouses, bundles, or subscriptions.
4. Supplier lead times
Lead time is the duration between placing an order with a supplier and receiving it.
For accurate forecasting, you need to consider multiple variables (mode of freight, production time, festive holidays) affecting the lead times.
For instance, if your supplier takes 30 days to deliver an order, but you expect a demand spike in 15 days, you might run out of stock before the new inventory arrives. Planning ahead and ordering well in advance allows you to maintain consistent stock levels, especially for high-demand items, and avoid the cash flow strain of emergency orders.
Also, if your supplier has a minimum order quantity (say, 1000 units), you need to time large purchases perfectly with your projected demand.
Prediko offers smart buying suggestions and a 1-click option to create purchase orders based on coverage levels, days of stock, lead times, current sell-through rate, and forecasted plans.
The aim is to forecast inventory in a way that helps you accommodate fluctuations in customer demand while minimizing excess stock costs. The following practical tips will help you achieve this.
1. Track search trends
To know what the future holds for your business, it is important to monitor online search behavior, social media activity, and marketplace trends related to your products.
Search trends are typically leading indicators of future demand. When people start searching more for "home office chairs," they're likely to make purchases in the next 2-4 weeks. This gives you valuable time to adjust inventory before the actual sales spike happens.
Use tools like Google Trends, Google Keyword Planner, or Hootsuite to regularly identify popular search terms and demand changes related to your products. Adjust the forecasts accordingly.
2. Pre-plan your “Pre-Order” or “Back-In-Stock” campaigns
Pre-order or back-in-stock campaigns allow customers to reserve items before they are available or notify them when items return to stock.
By offering these options, you can collect demand data directly from customers, giving you a clearer picture of how much inventory to order without overcommitting. It also helps maintain customer interest and minimize frustration when items sell out quickly.
8 Best Shopify back-in-stock apps: Features, pricing, and more
Enable pre-orders or back-in-stock email/push alerts for high-demand items. Track conversion rates on these notifications. Add a "Notify Me" button on out-of-stock products and see how many customers opt-in and use this data to inform future purchasing.
3. Keep track of product life cycles and evergreen items
Not all products have the same lifecycle. Some items, like seasonal clothing, may only be relevant for a short time, while others, such as classic t-shirts, may have steady, year-round demand. You must identify where each product falls in its lifecycle to avoid ordering excess stock for items that are nearing the end of their relevance or have less stable demand.
Categorize each product based on its lifecycle stage (introduction, growth, maturity, decline) and modify forecasts accordingly. For seasonal items, gradually reduce order quantities as the season progresses. For evergreen items, set high minimum stock levels but adjust for any trends or demand shifts.
4. Collaborate with relevant functions
Collaboration between departments like marketing, sales, supply chain, and support ensures that promotions, customer preferences, and feedback align with your inventory needs.
Schedule regular cross-departmental meetings where teams can discuss key updates. You may hold monthly meetings with Marketing to review upcoming campaigns, Sales to discuss bulk orders and customer feedback, and the Product team to cover new launches or updates. Maintaining a shared calendar for demand-impacting events is also a good idea.
5. Consider complementary products, geographical demand, and other external factors
Products don't exist in isolation. Printer sales affect ink cartridge demand, regional weather affects clothing sales, and local events or influencer campaigns can drive sudden spikes in certain products.
The idea is to go beyond historical sales data and accommodate external factors as well. Analyze past sales to identify which products are frequently bought together and alter forecasts for these complementary items. Similarly, use geographic sales data or weather trends to stock popular products in areas with higher demand.
If winter coats sell well in northern states but not in southern ones, adjust your inventory distribution accordingly.
Increasingly, brands also factor in creator-led demand signals such as influencer content performance and UGC traction, to anticipate sudden spikes and adjust forecasts before demand fully shows-up in sales data.
6. Keep a “Forecast adjustment fund”
Unforeseen shifts in demand can disrupt even the best forecasts. Set aside a percentage of your inventory budget specifically for forecast adjustments.
Use this fund for unexpected restocks or last-minute orders as needed. For example, if an influencer’s post causes a sudden spike in demand, you can quickly reorder that product without disrupting your main budget. This pre-planning can prevent stockouts and missed revenue.
7. Don’t forget to account for returns and exchanges
Returns and exchanges affect both available stock and future ordering needs. Calculate average return and exchange rates for each product category and adjust future orders accordingly.
If a product typically sees a 20% return rate, account for this in your forecast so that you’re not caught with excess or insufficient inventory after returns are processed. Monitor return reasons to identify specific issues, improve your products, and work towards reducing return rates in the future.
If you’re a Shopify store owner, then Prediko can be your perfect choice. Prediko is an AI-powered software that automates much of the manual work involved in inventory forecasting.
It covers important aspects such as analyzing seasonal trends, predicting demand fluctuations, managing purchase orders, and suggesting optimal reorder points.
Here’s what Prediko brings to the table
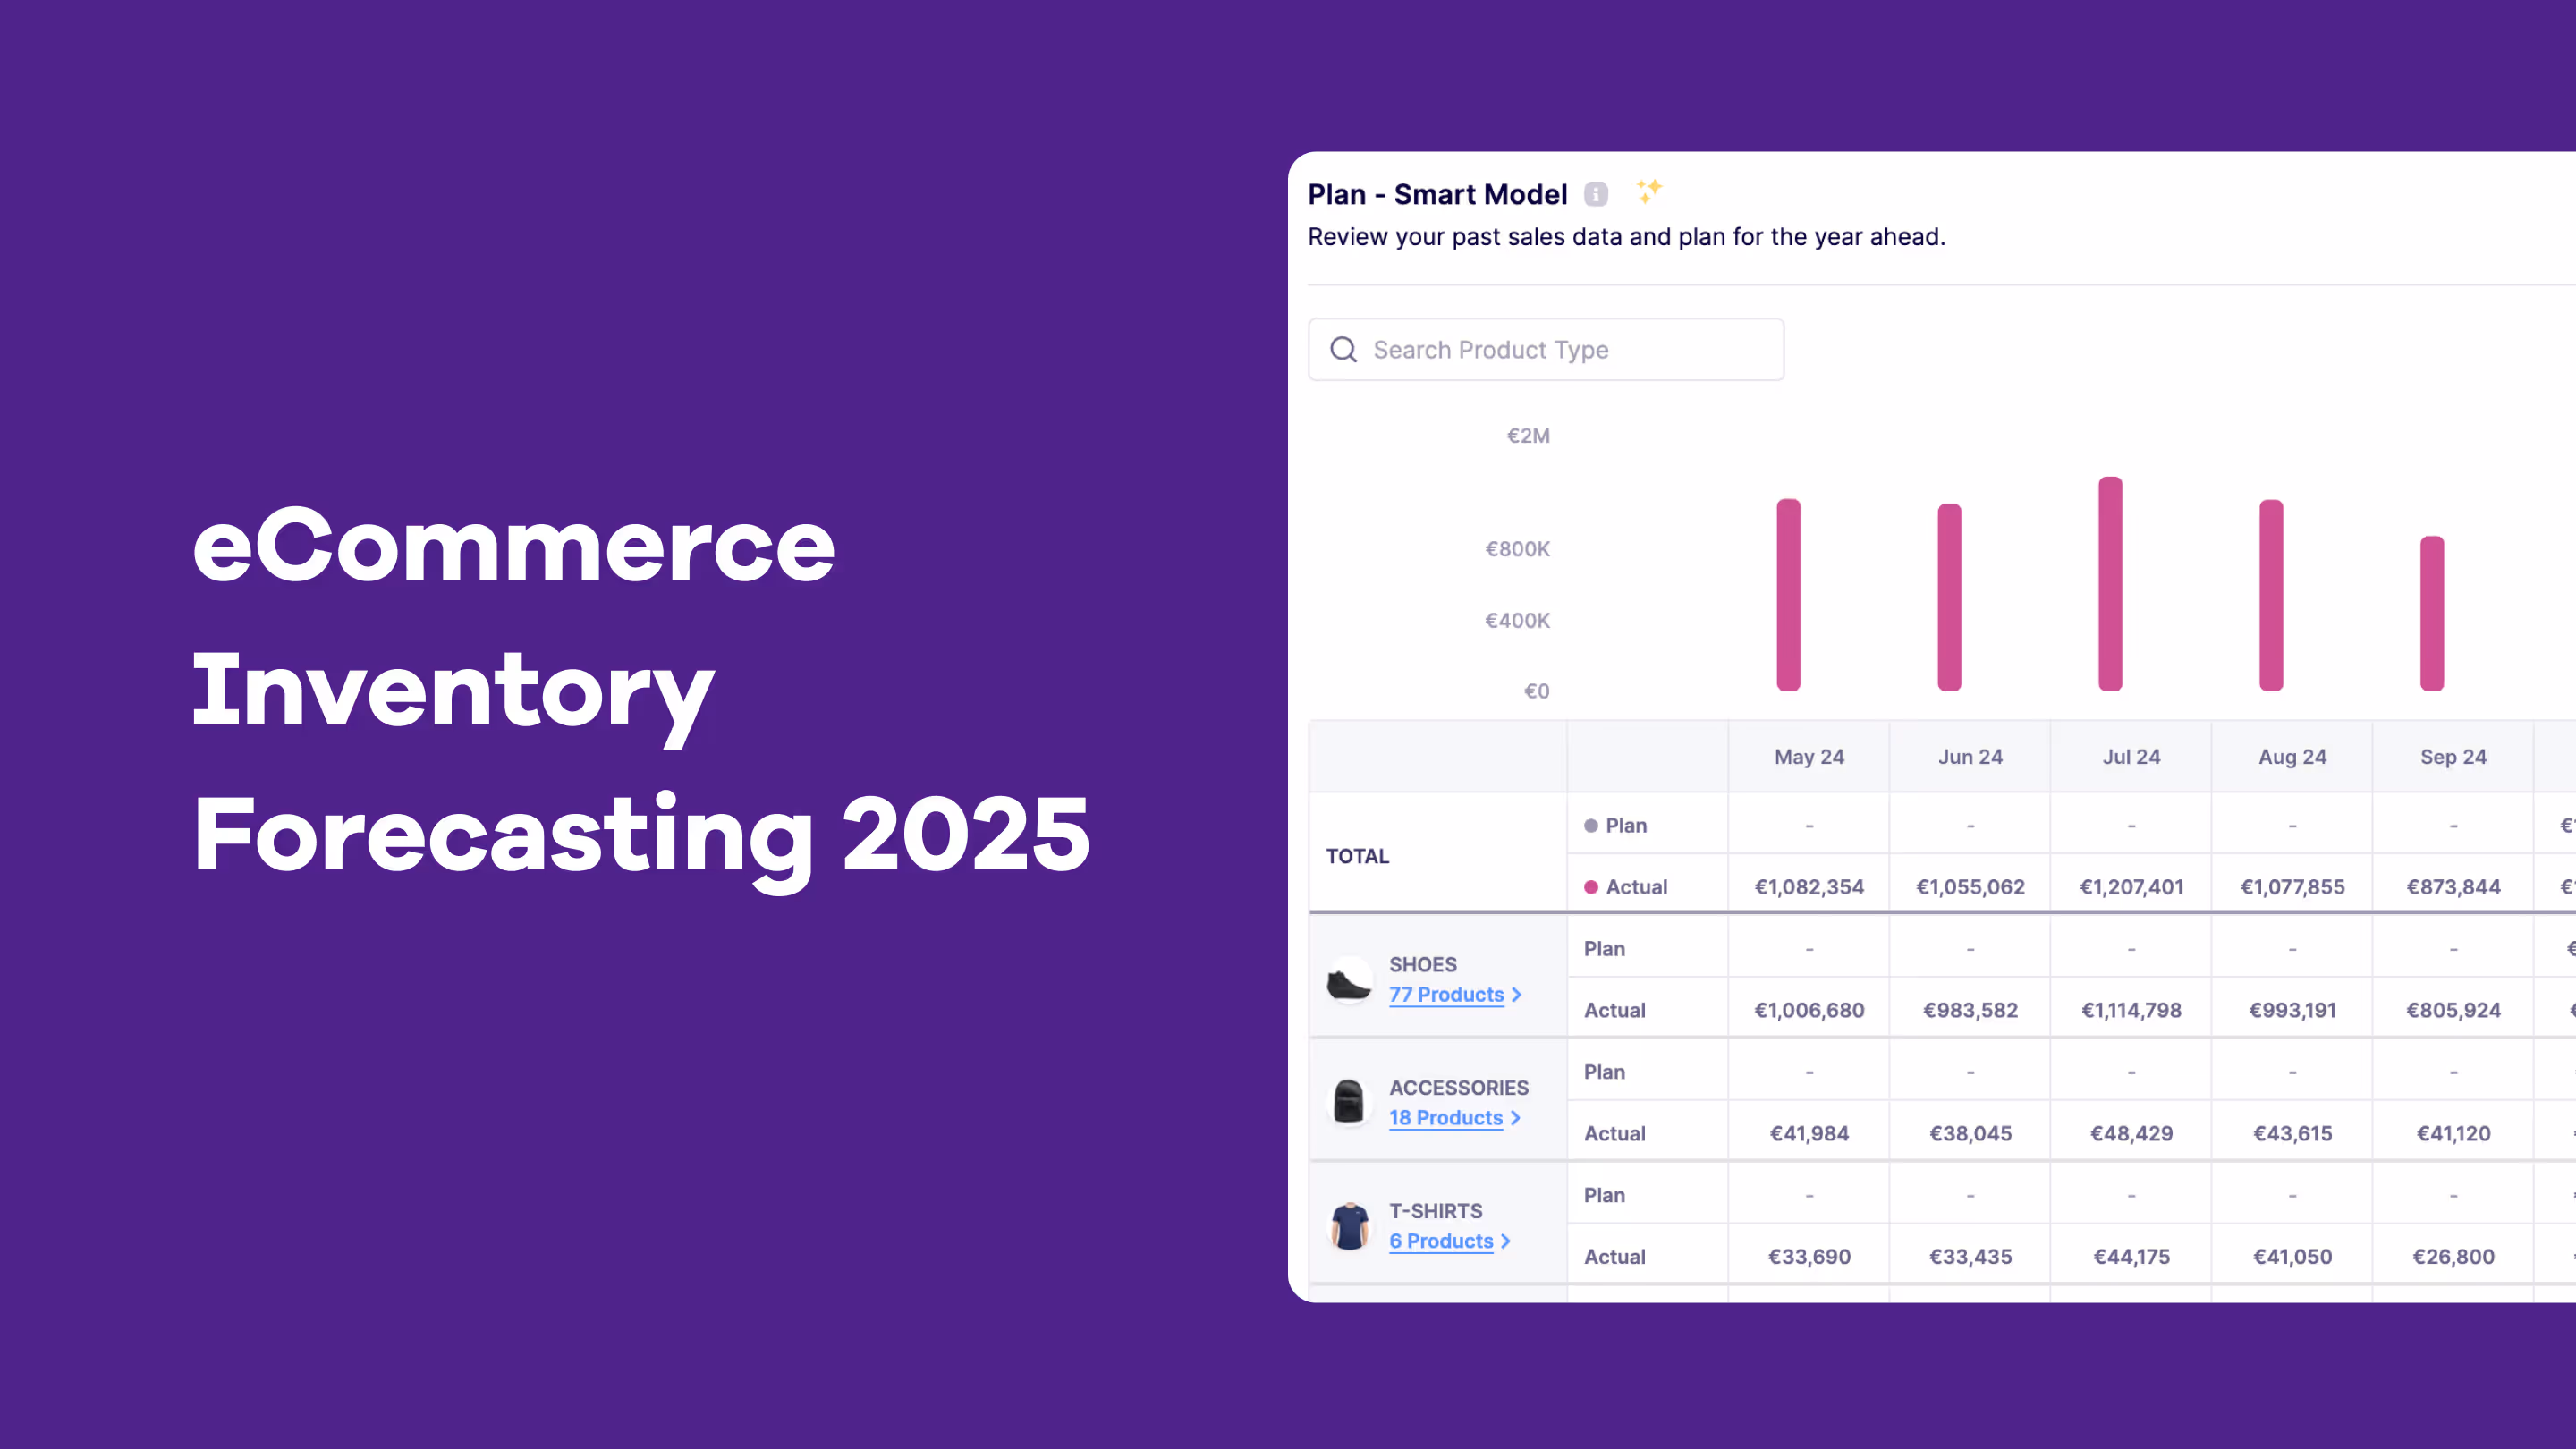
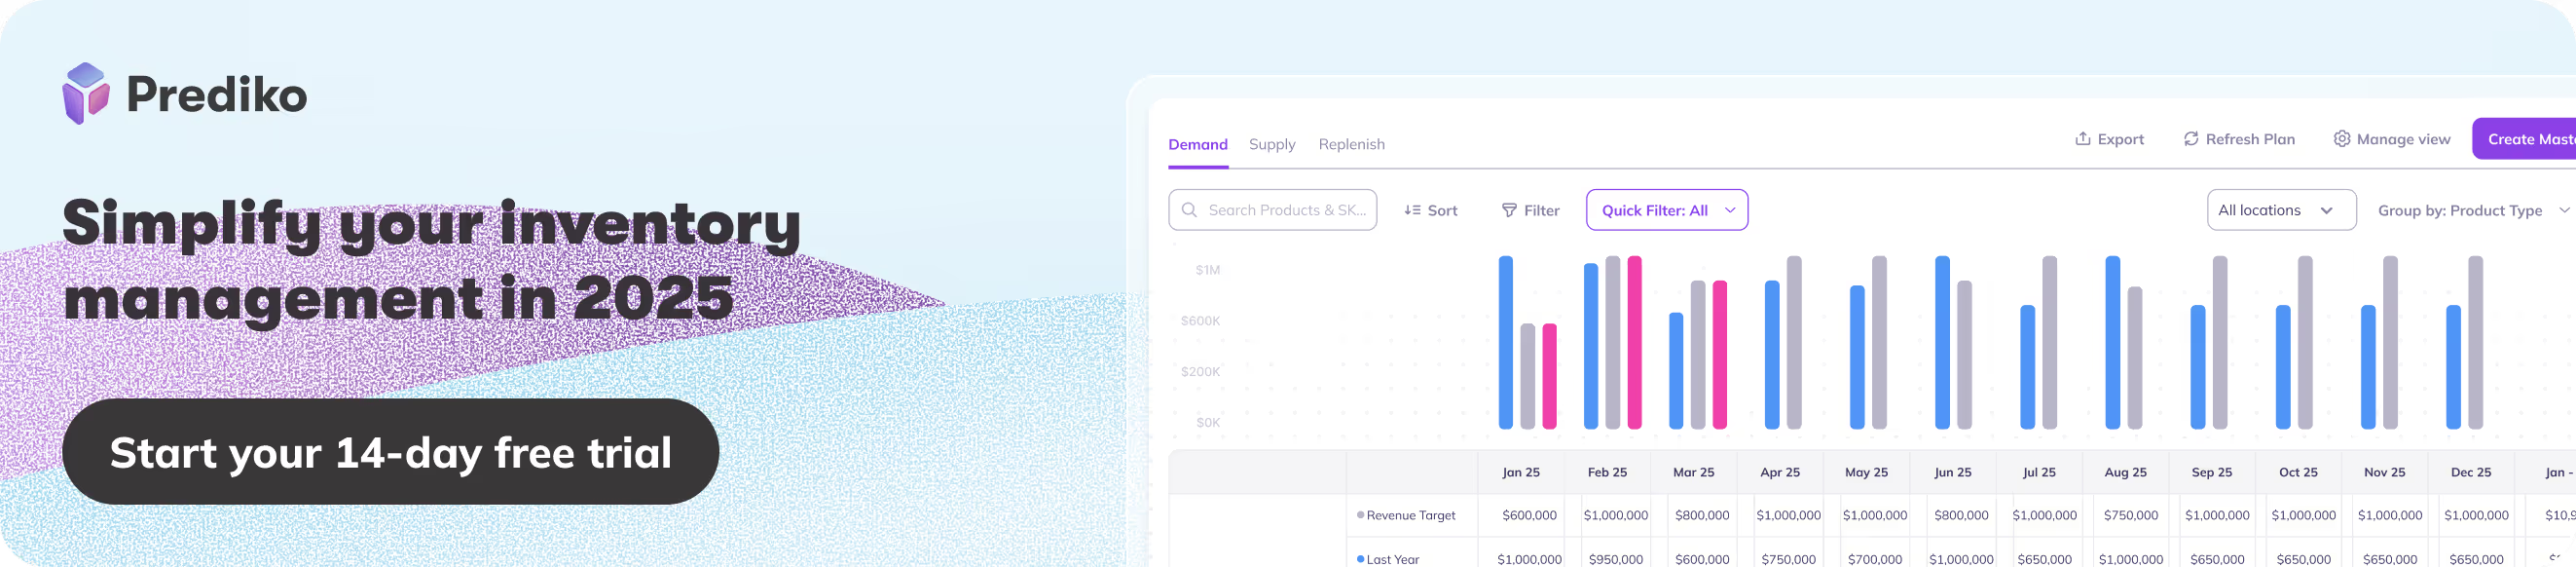
- AI-based demand planning for Shopify: Prediko’s AI algorithms turn your historical sales data into actionable inventory forecasts. By analyzing your sales patterns, it automatically identifies seasonal and growth trends and then projects your revenue goals over the next 12 months. You can also adjust plans manually and compare actual performance against targets. 100+ customizable filters let you drill down your plan at every level, from individual SKUs to broader categories.
- Inventory sync across channels: Managing inventory across multiple stores, warehouses, and subscriptions can be messy. Prediko brings order by consolidating multi-channel sales and stock data into a single view. Whether it’s syncing information for bundled products or tracking inventory at multiple locations, you can see everything in real-time and data is always ready for analysis.
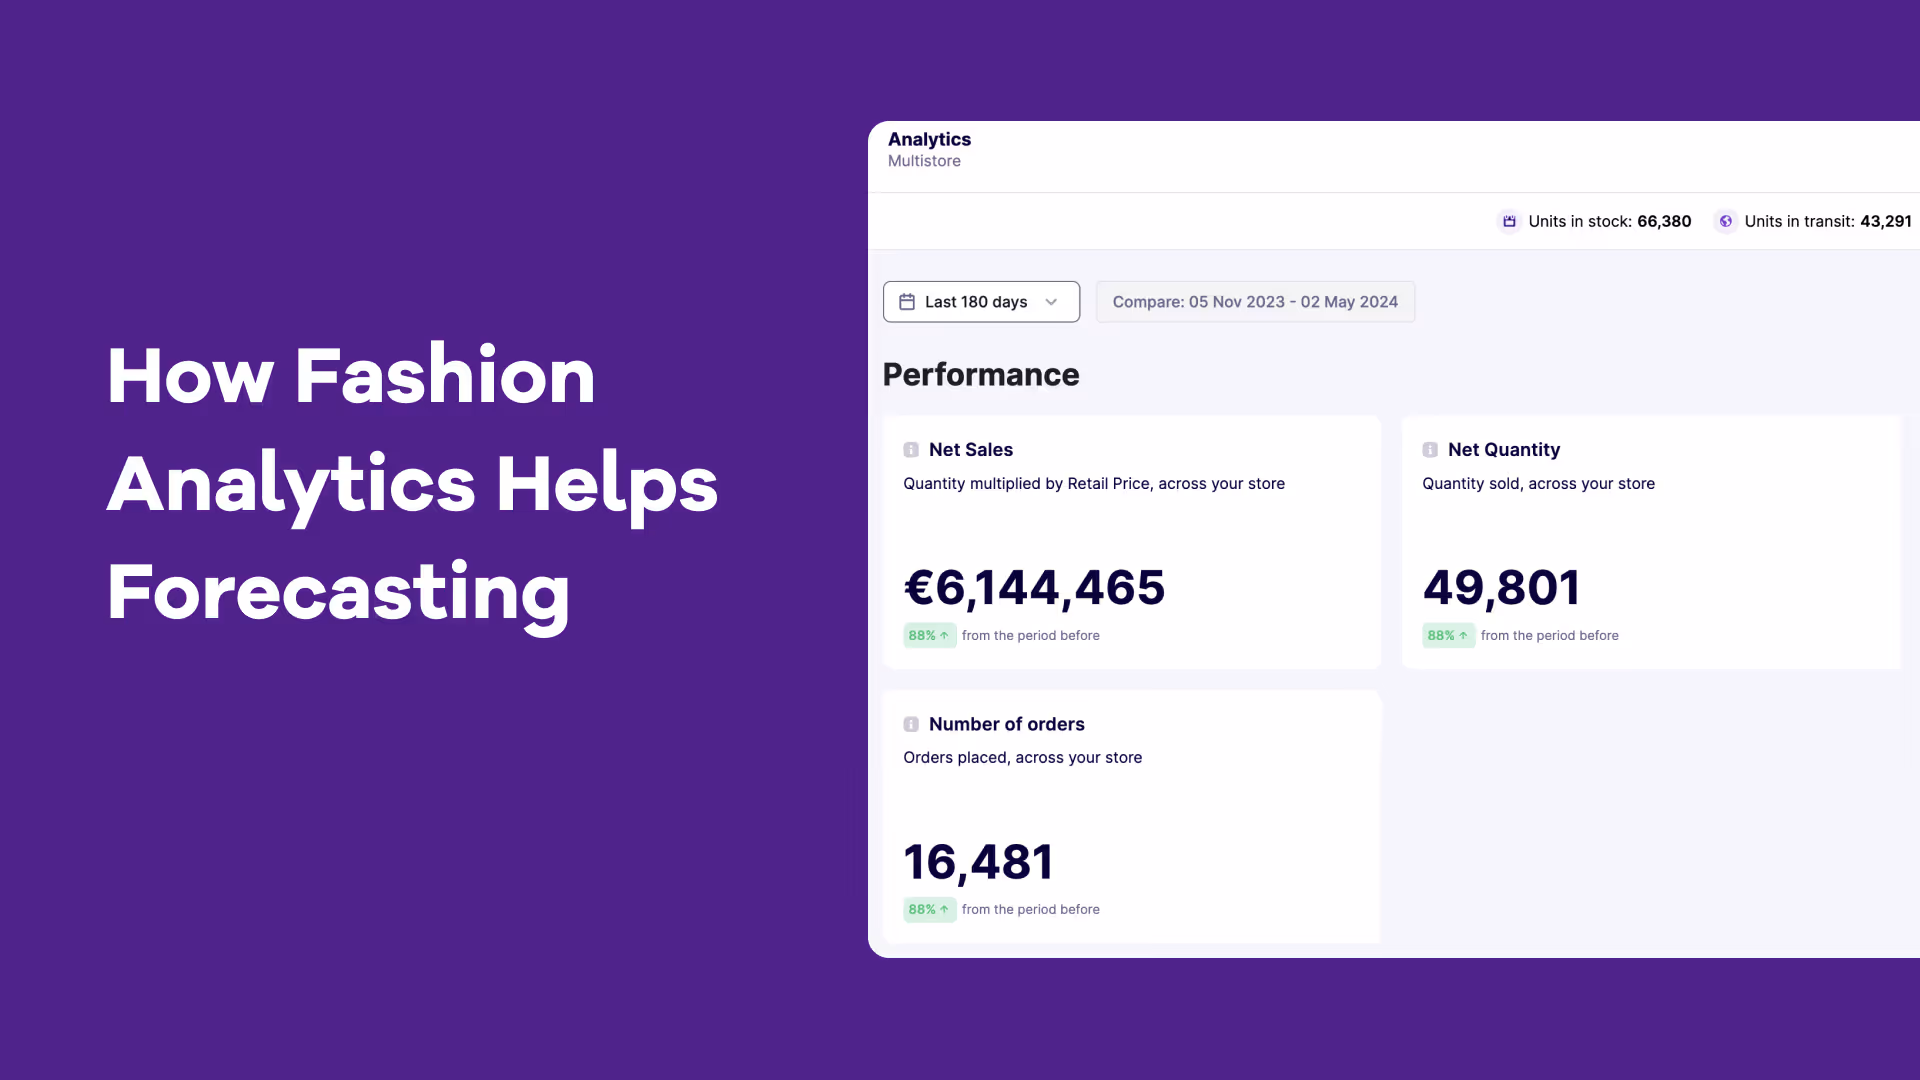
- Stock insights and reports: Gain access to metrics like which products are performing best, track overdue purchase orders, and understand what percentage of your sales plan you’ve achieved for the week. You can also compare both retail and inventory values.
- Raw material management: Prediko also lets you track raw materials, giving you an integrated view of everything you need for production. You can import all your raw material data even if you manage items across multiple warehouses. Quickly create and update detailed Bills of Materials (BOMs) and keep production aligned with demand.
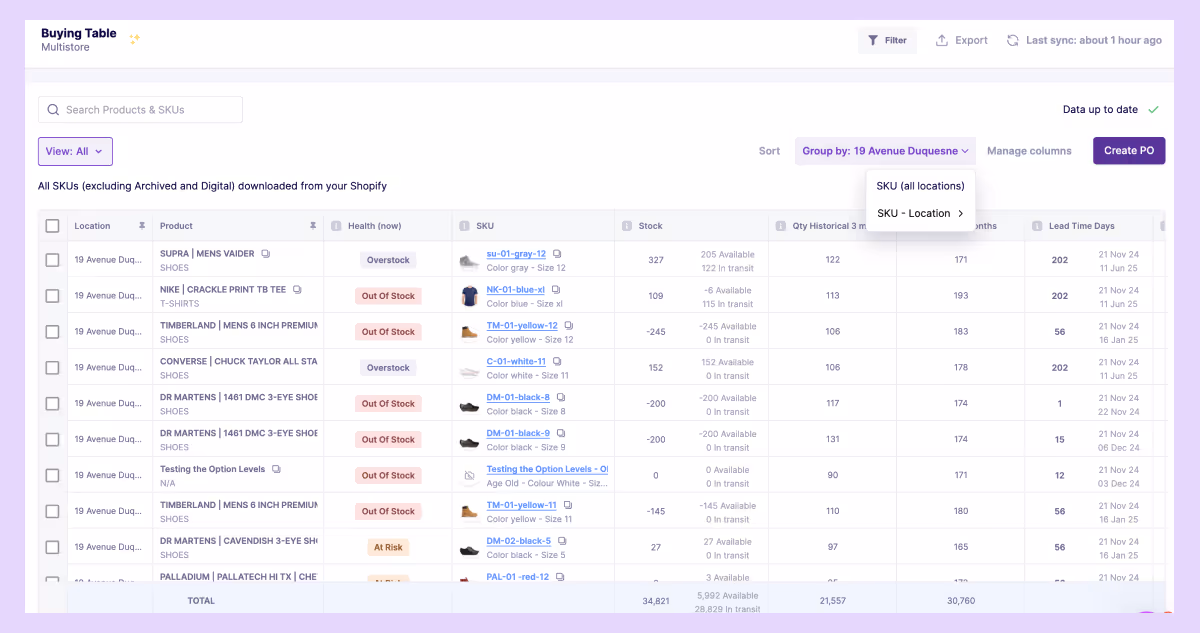
- Buying table: Prediko’s Buying Table makes purchase planning intuitive. With a familiar Airtable-like interface, it tells you exactly what to buy, when, and in what quantities.
It offers live recommendations based on real-time analysis of stock cover levels, lead times, and sell-through rates. You can dive deep into your inventory needs using its 90+ metrics and create purchase orders with one click.
- Purchase order (PO) management: With Prediko, you can also handle the entire procurement process as the stock data is automatically synced with Shopify.
Create and track POs using live data and communicate in-app or via exports with suppliers. Integrate with WMS solutions like ShipHero for an even smoother experience.
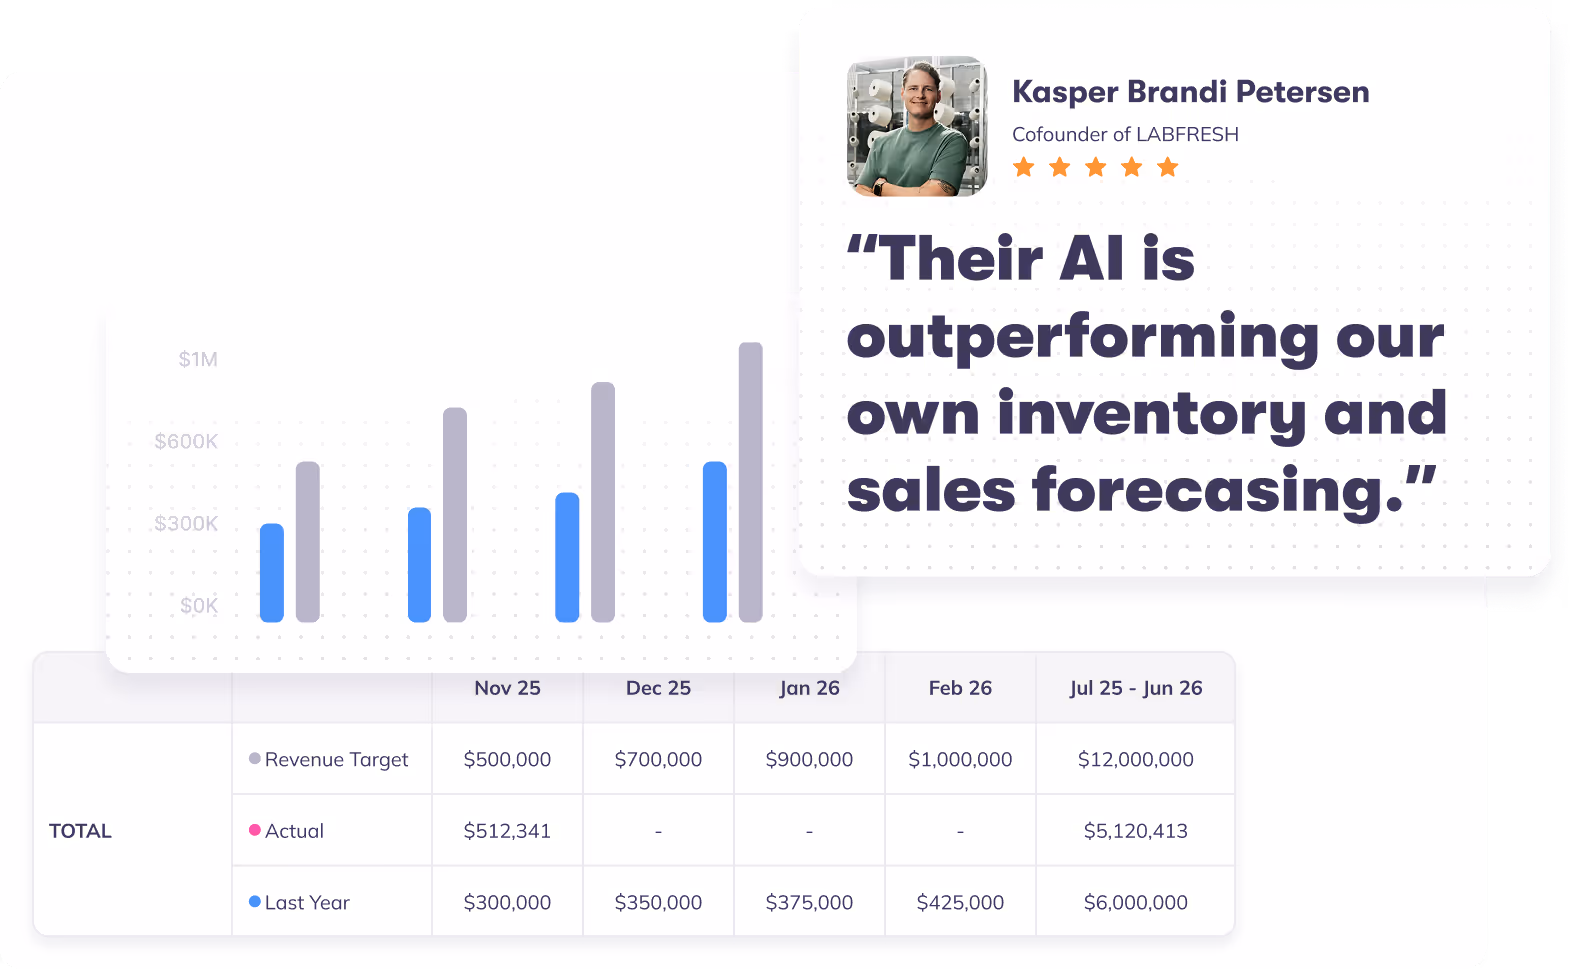
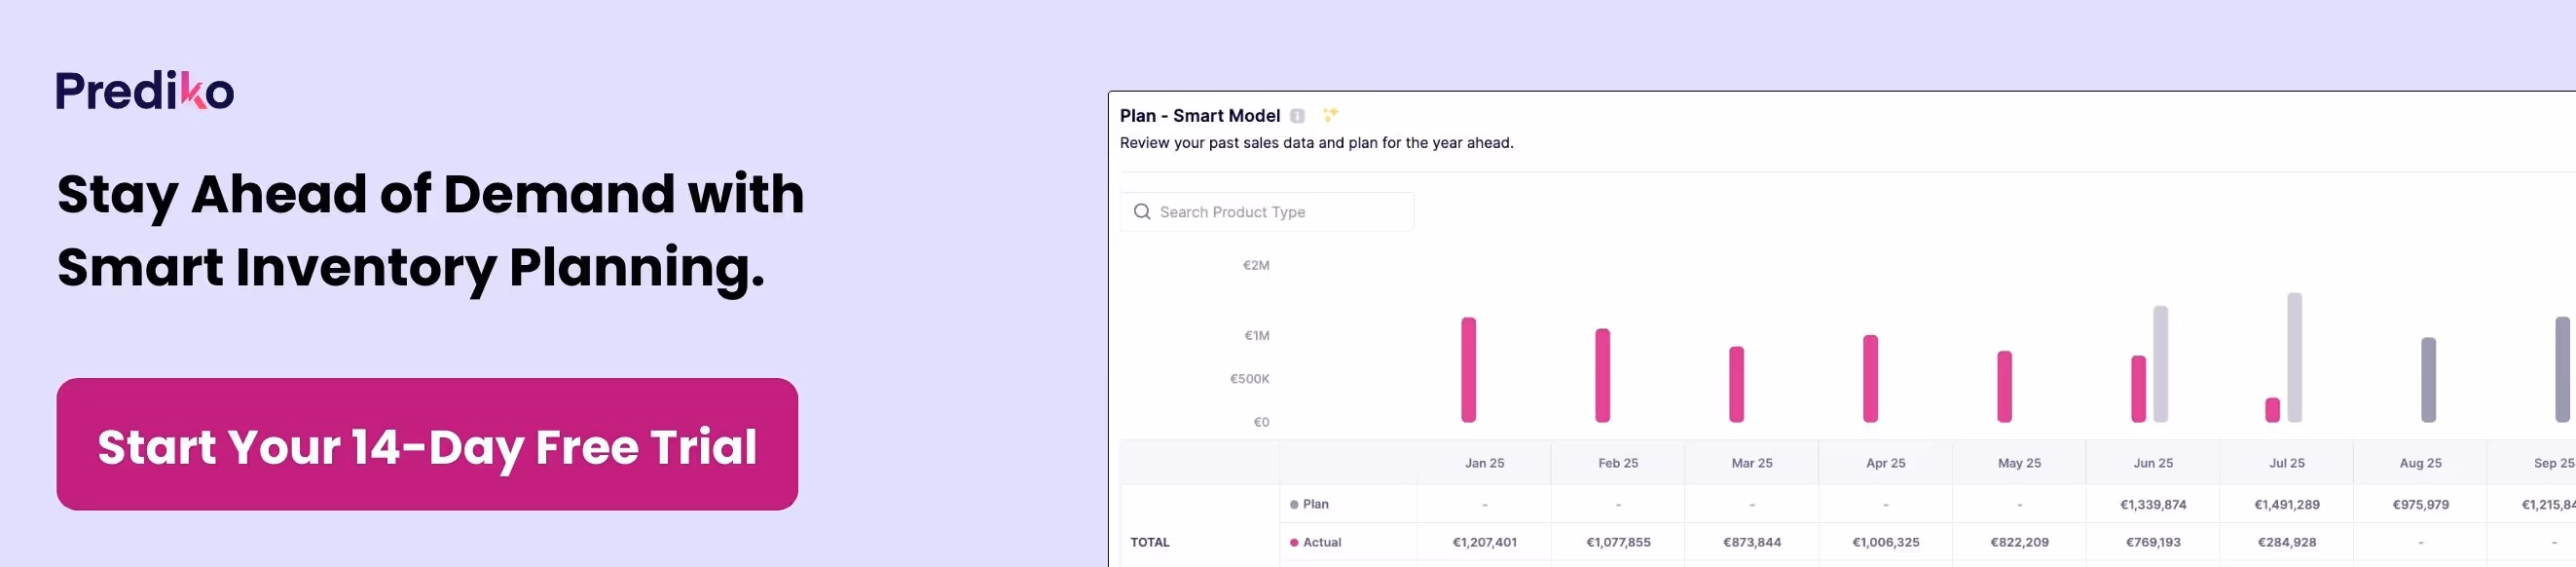
1000+ brands trust Prediko for inventory management and forecasting. See why with a 14-day free trial.