Analytics & Reports to go From Raw Inventory Data to Your Next Decision
20+ pre-built reports for stockouts, COGS, deadstock, and sell-through, and a 100% customizable analytics dashboard so every team can make decisions based on the right numbers.







.avif)
.png)



















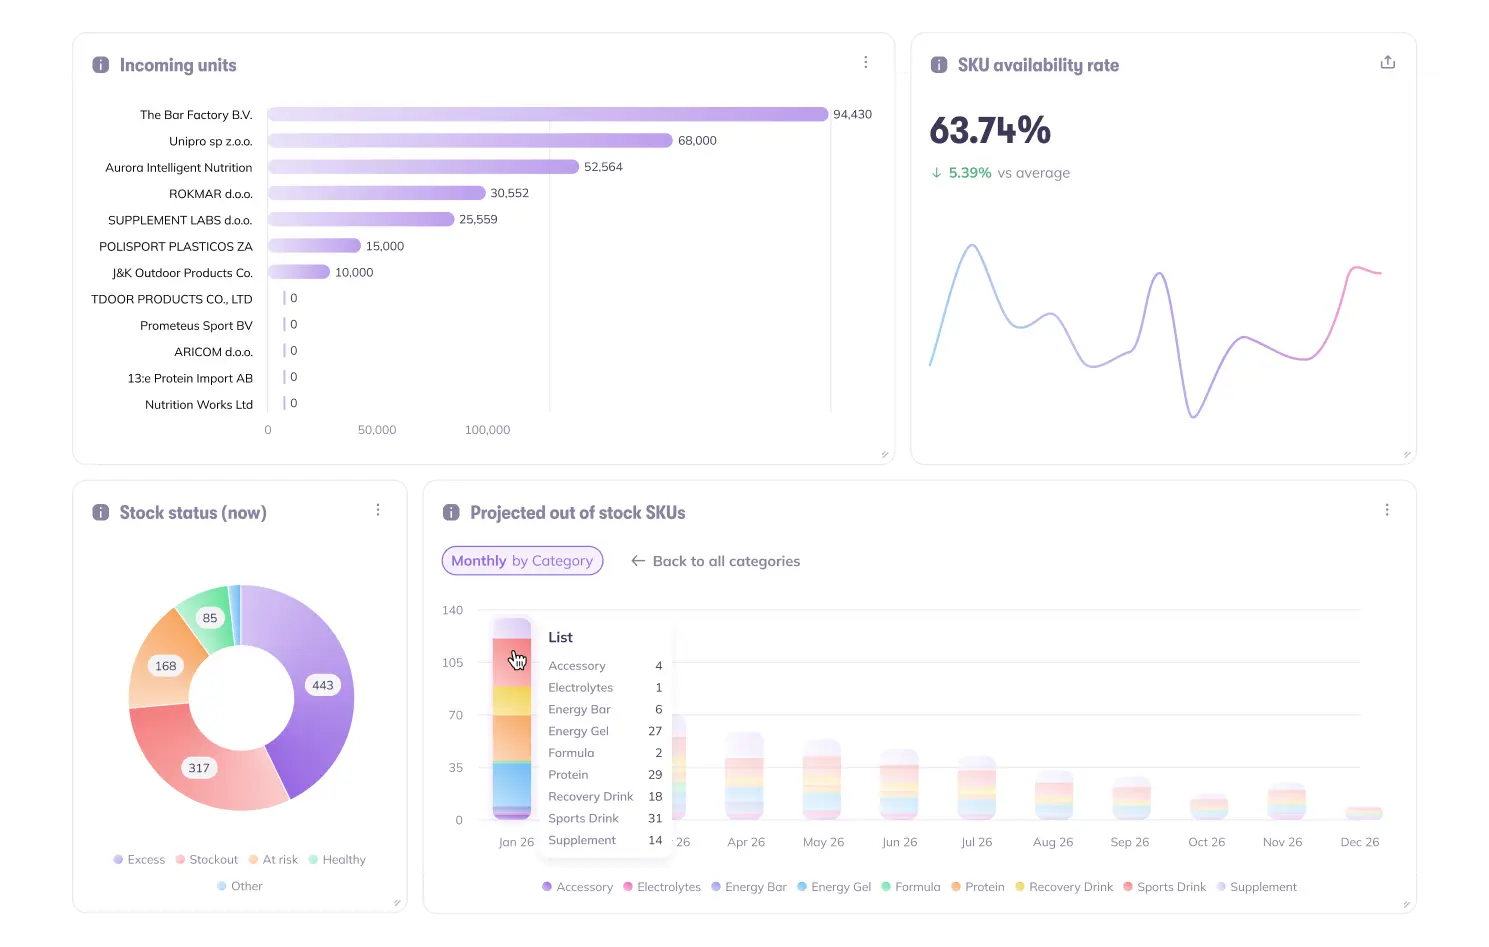
Custom dashbaords for sales, ops, and finance
Reports answer specific questions. Analytics dashboards answer ongoing ones. Create unlimited custom dashboards that matter to each team: sales, ops, finance and pin them front and centre.
- Bar, column, and pie charts pulling from inventory and sales data
- Drill from category → product → SKU with one click
- Group by location, category, or product type
- Set granularity: daily, weekly, monthly, or quarterly
- Drag, drop, and resize dashboards any time you like
20+ ready-made reports for critical inventory metrics
Your inventory table has every column imaginable. Finding the signal is the hard part. Prediko offers 20+ focused reports: each pre-filtered, pre-sorted, and ready to act on the moment you open them. No more building reports from scratch.
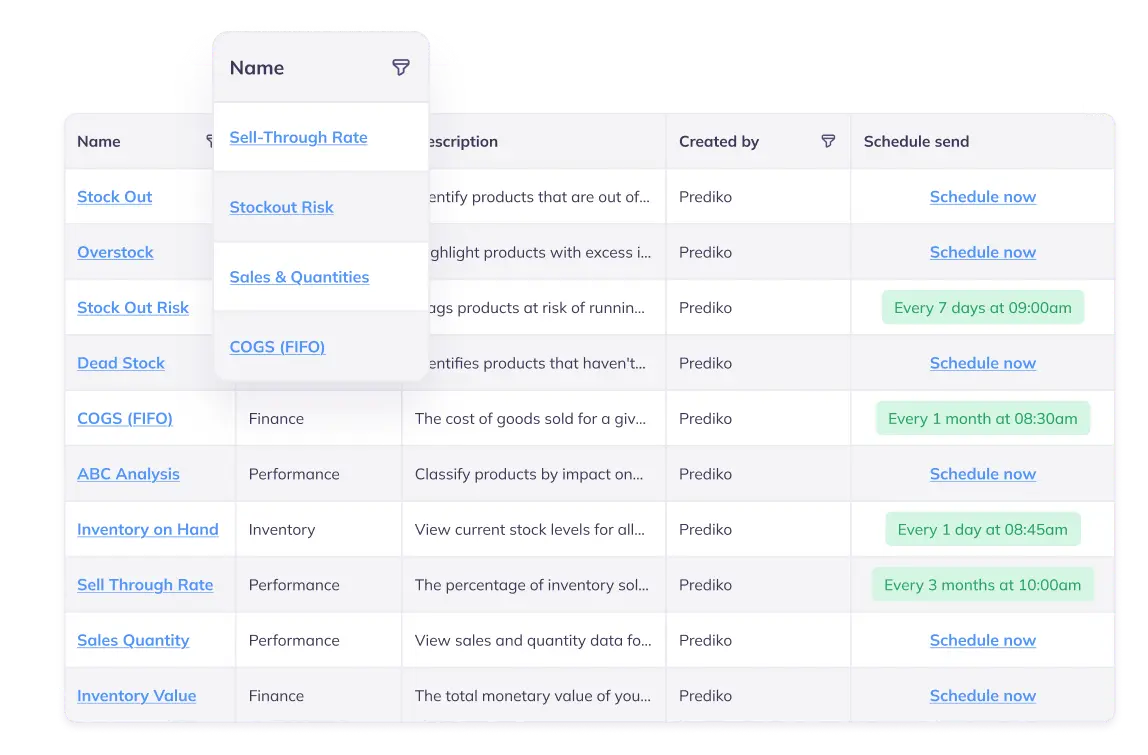

Customize any report, save it, and share it
Each report comes with a default filter that defines it. You can layer additional filters on top and save them so you can return to them anytime.
- Easily name your saved views
- Sort any column ascending or descending
- Export to Excel directly from the report header
- Access Prediko inventory and reporting context from Claude or ChatGPT through the Prediko MCP for AI assistants.
- Clashing filter warnings so your views always make sense
Your Monday morning inventory health report, already in your inbox
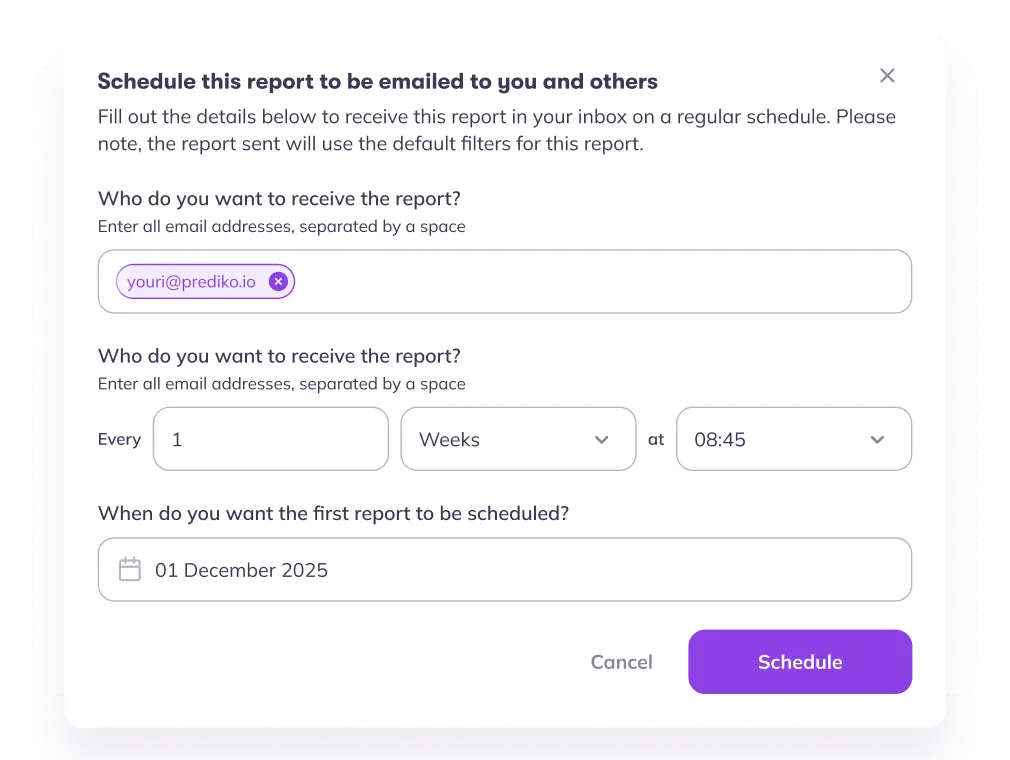
Set up any filtered report to send on a schedule: daily, weekly, or monthly. Pick your recipients, set the time, and never manually export a spreadsheet again.
- Send to any email address; perfect for sharing with execs or suppliers
- Works with any custom view, not just the defaults
- Set frequency and start date in seconds



"Amazing App. Gives a great visual on current and future inventory. We decreased stockout from 4% to 1% in 2 months with Prediko. That’s hundreds of thousands of extra revenue per year unlocked! Team are super supportive to any requests too! Would highly recommend!"

"The software and customer service are amazing! Prediko’s advanced analytics and reporting tools empowered us at Kate Hewko to predict demand patterns accurately, optimizing stock replenishment and reducing stockouts."

"Prediko helps me forecast my sales accurately and tells me how much I should order. Plus as a whole it's much more robust than my previous software (Cogsy), which is something I needed for a business as SKU heavy as mine."


.avif)



“Since day one… there is one report I started using first, which is sales and quantities. And it’s been really, really helpful. In Prediko, you can just set any timeframe, and you get the full data across all stores or just one store, which is great.”

“The app allows us to create and export detailed inventory reports in CSV and PDF formats, with over 50 filters for customization.”
.avif)
“We also find Prediko a very easy application to use and it is very helpful with forecasting and reporting.”

Let’s answer some FAQs

Shopify's built-in inventory reports give you month-end snapshots and basic sell-through data. Prediko goes further as it calculates estimated revenue lost per stockout, flags deadstock and overstock automatically, does FIFO-based COGS with landed cost, and lets you build fully custom dashboards on top.
At minimum: stockout, stockout risk, overstock, deadstock, and COGS. If you're making buying decisions, add ABC analysis. Prediko ships all of these pre-built and pre-filtered that are ready the moment you connect your store. To keep these reports accurate, regularly verify your physical inventory using Prediko’s Shopify stocktake inventory scanner to identify discrepancies and keep stock levels up to date.
It's the percentage of available inventory you actually sold in a given period. Above 80% is healthy. Below that, you're likely sitting on stock that's quietly draining cash. Prediko tracks it at SKU, product, and category level so you know exactly where the problem is.
A way of ranking products by revenue contribution. A-grade items drive ~80% of revenue, B-grade the next 15%, C-grade the rest. It tells you where to focus buying and storage. Prediko's ABC report keeps this updated automatically.
FIFO (First-In, First-Out) matches each sale to your oldest stock batch first. It matters for COGS because it decides which product costs are matched to sales, affecting your gross margin, profit, and inventory value.





.avif)